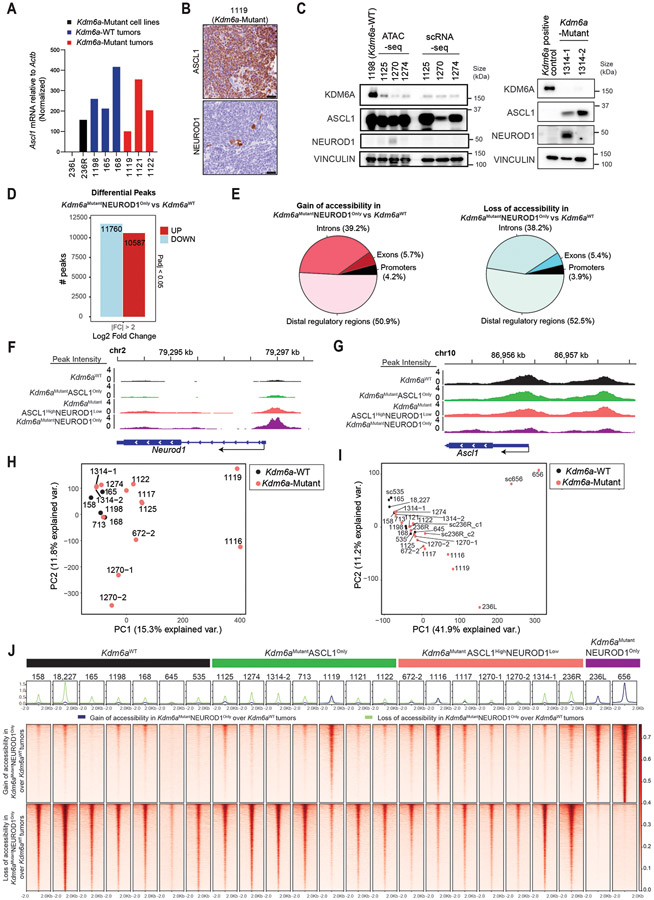
Extended Data Fig. 3. Analysis of Bulk ATAC-seq from Kdm6a-Mutant vs. Kdm6a-WT Tumors from Fig. 3.
(a) RT-qPCR for Ascl1 mRNA expression relative to Actb and then normalized to Ascl1 expression in the 236L cell line of mouse SCLC lung tumors from Fig. 3a. (b) IHC for ASCL1 and NEUROD1 from the 1119 Kdm6a-Mutant mouse SCLC tumor showing rare NEUROD1-positive cells. Scale Bar= 50 μm. (c) Immunoblot analysis of SCLC lung tumors formed in an additional cohort of LSL-Cas9 mice injected with sgControl RPP (Kdm6a-WT) or sgKdm6a RPP (Kdm6a-Mutant) adenoviruses. For the immunoblot on the left, a separate piece of each tumor was used for bulk ATAC-seq and scRNA-seq experiments and hence immunoblots were run for each sample. Note that the piece of tumor 1270 used for ATAC-seq did show faint NEUROD1 expression while the 1270 sample used for scRNA-seq did not show any detectable NEUROD1 expression. This was likely related to heterogeneity within the tumor sample. (d) Bar graph of upregulated (red) and downregulated (blue) differential accessible peaks with LFC>2, pAdj<0.05 from ATAC-seq data used to identify accessibility changes in Kdm6aMutantNEUROD1Only tumors for analyses in Figs. 3e,f and hence differential accessibility analysis was performed comparing Kdm6aMutantNEUROD1Only tumors (236, 656) vs. Kdm6aWT SCLC tumors (158, 18227, 165, 1198, 168, 645, 535, sc535). p-values are calculated using Wald test in DEseq2 and adjusted for multiple hypothesis testing. (e) Pie charts of genomic location of differential accessible peaks from d. (f,g) Chromatin accessibility tracks for the average of each phenotype indicated (see Figs. 3c-g) at Neurod1 (f) or Ascl1 (g) from all ATAC-seq data from Fig. 3d. (h, i) PCA of all ATAC-seq data from Fig. 3c (h) and Fig. 3d (i) now classified by genotype (Kdm6a-Mutant vs. Kdm6a-WT) rather than phenotype. (j) Heat maps of ATAC-seq read densities from all bulk ATAC-seq data from Figs. 3d-f showing gain (n=11,760 peaks) or loss (n=10,587) of accessibility in Kdm6aMutantNEUROD1Only vs Kdm6aWT SCLC tumors (see Extended Data Fig. 3d) for all phenotypes indicated.

