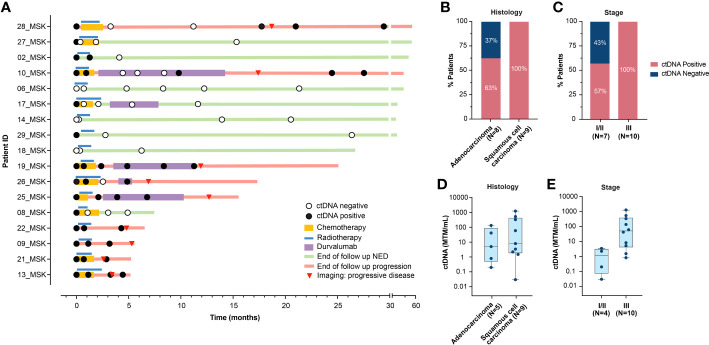
Figure 1.
(A) Overview plot depicting treatment regimen, longitudinal ctDNA analysis and clinical outcomes for each patient in the cohort. (B, C). Pre-RT ctDNA detection rate based on (B) histology, and (C) stage. (D, E). Pre-RT ctDNA levels (MTM/mL) in 14 patients with detectable ctDNA based on (D) histology, and (E) stage. RT, radiotherapy; ctDNA, circulating tumor DNA; NED, no evidence of disease; MTM, mean tumor molecules.

