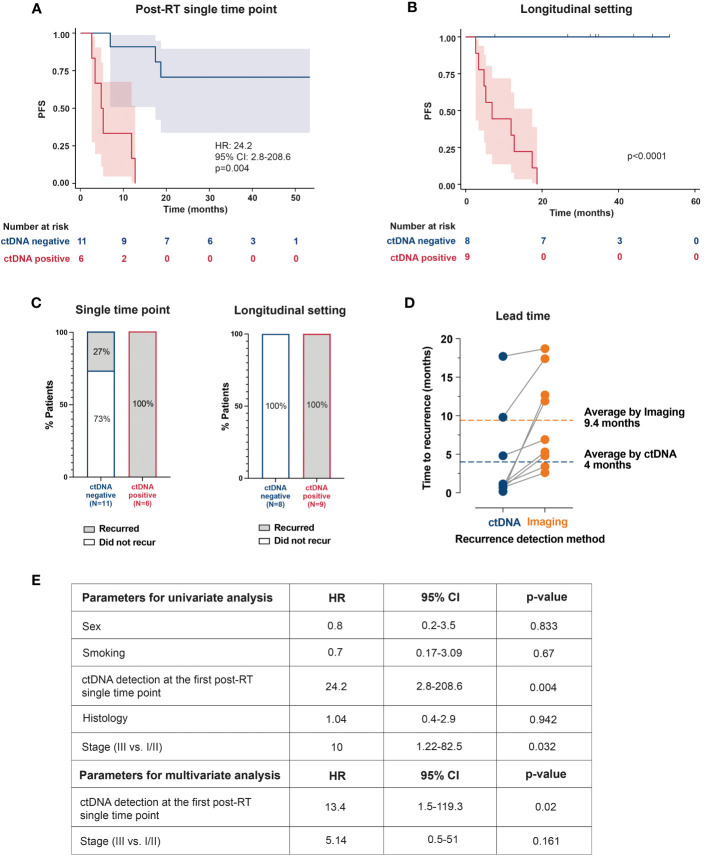
Figure 2.
Kaplan–Meier plots representing the association of ctDNA positivity with PFS: (A) at the first available post-RT timepoint (B) and in longitudinal setting (C) The bar plots show recurrence rates in ctDNA-positive and ctDNA-negative patients at a single timepoint and longitudinally. (D) Comparison between ctDNA and radiographic imaging. Lead time indicates the number of months by which the ctDNA detected molecular recurrence ahead of radiological progression. (E) Univariate and multivariate analyses of prognostic factors and their association with PFS. RT, radiotherapy; PFS, progression-free survival; HR, hazard ratio; CI, confidence interval.

