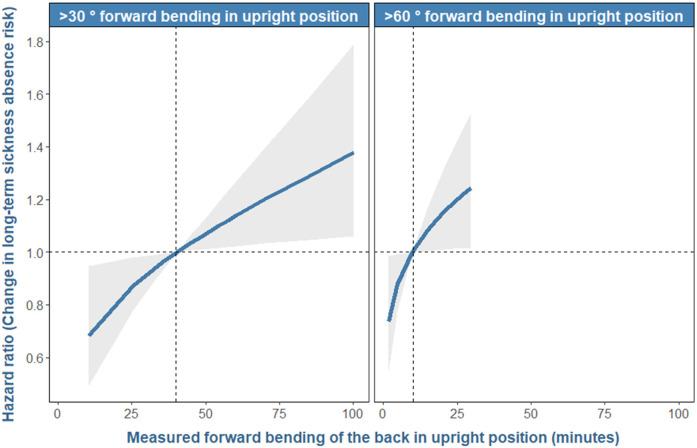
Figure 2.
Results of the direction and strength of the association between worktime with forward bending of the back >30˚ and >60˚ in an upright position and prospective relative risk of long-term sick-ness absence among 944 workers. The X-axis represents the measured minutes of worktime spent with forward bending of the back >30˚ and >60˚. Y-axis shows the hazards ratio indicating the risk of long-term sickness absence relative to the risk associated with the “average” forward bending of the back. These averages for >30° and >60° were 40 and 10 minutes, respectively and are indicated by the vertical dotted line on the x-axis. The associated risk at these averages is 1 and is indicated by the horizontal dotted line on the y-axis. Refer to figure 3 for the absolute risk associated with these average time. The ribbons along the line show the 95% confidence intervals of the resulting estimates. The reason behind why we observe non-linear patterns in these figures is given in these articles (34, 50).

