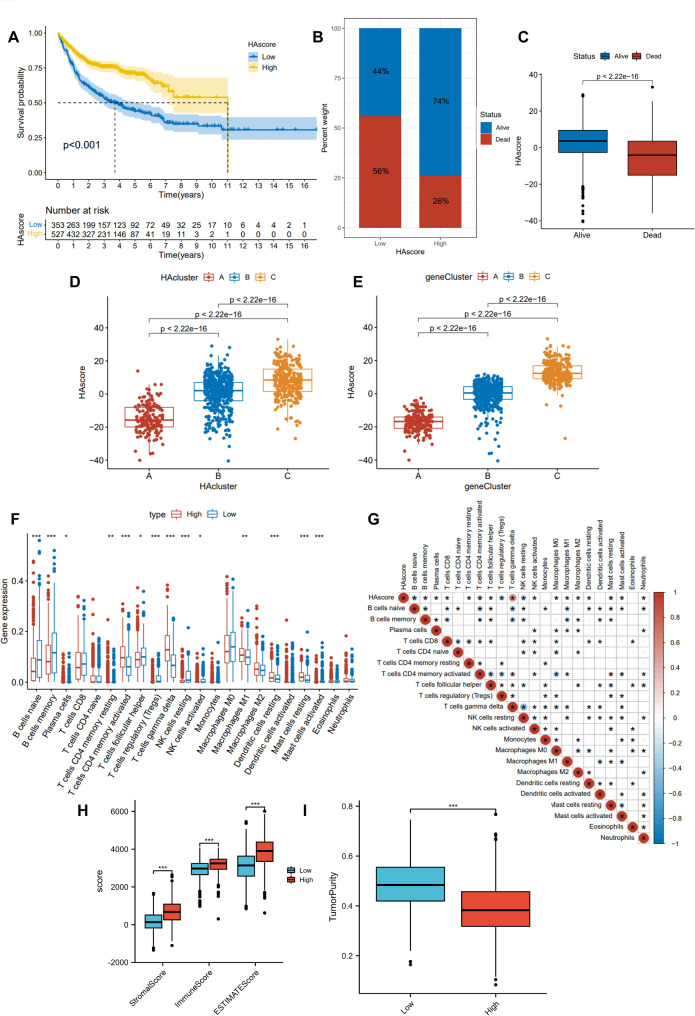
Fig. 5.
HA score groups with prognosis and immunological characteristics. (A) Kaplan–Meier curve of the patients with different HAscores cohort. (B-C): The percentage of patients in low HAscore groups and high HAscore groups with differing survival outcomes. Differences between survival status groups in terms of HAscore. (D): Differences between scores among three HAclusters in the DLBCL cohort. (E): Difference in scores between three gene clusters in the DLBCL cohort. (F-G): The differential and correlation between the HA score and TICs were analyzed using the CIBERSORT algorithm. (H): The difference in TME scores between the groups according to their HAscore. (I): TumorPurity between the HAscore groups.

