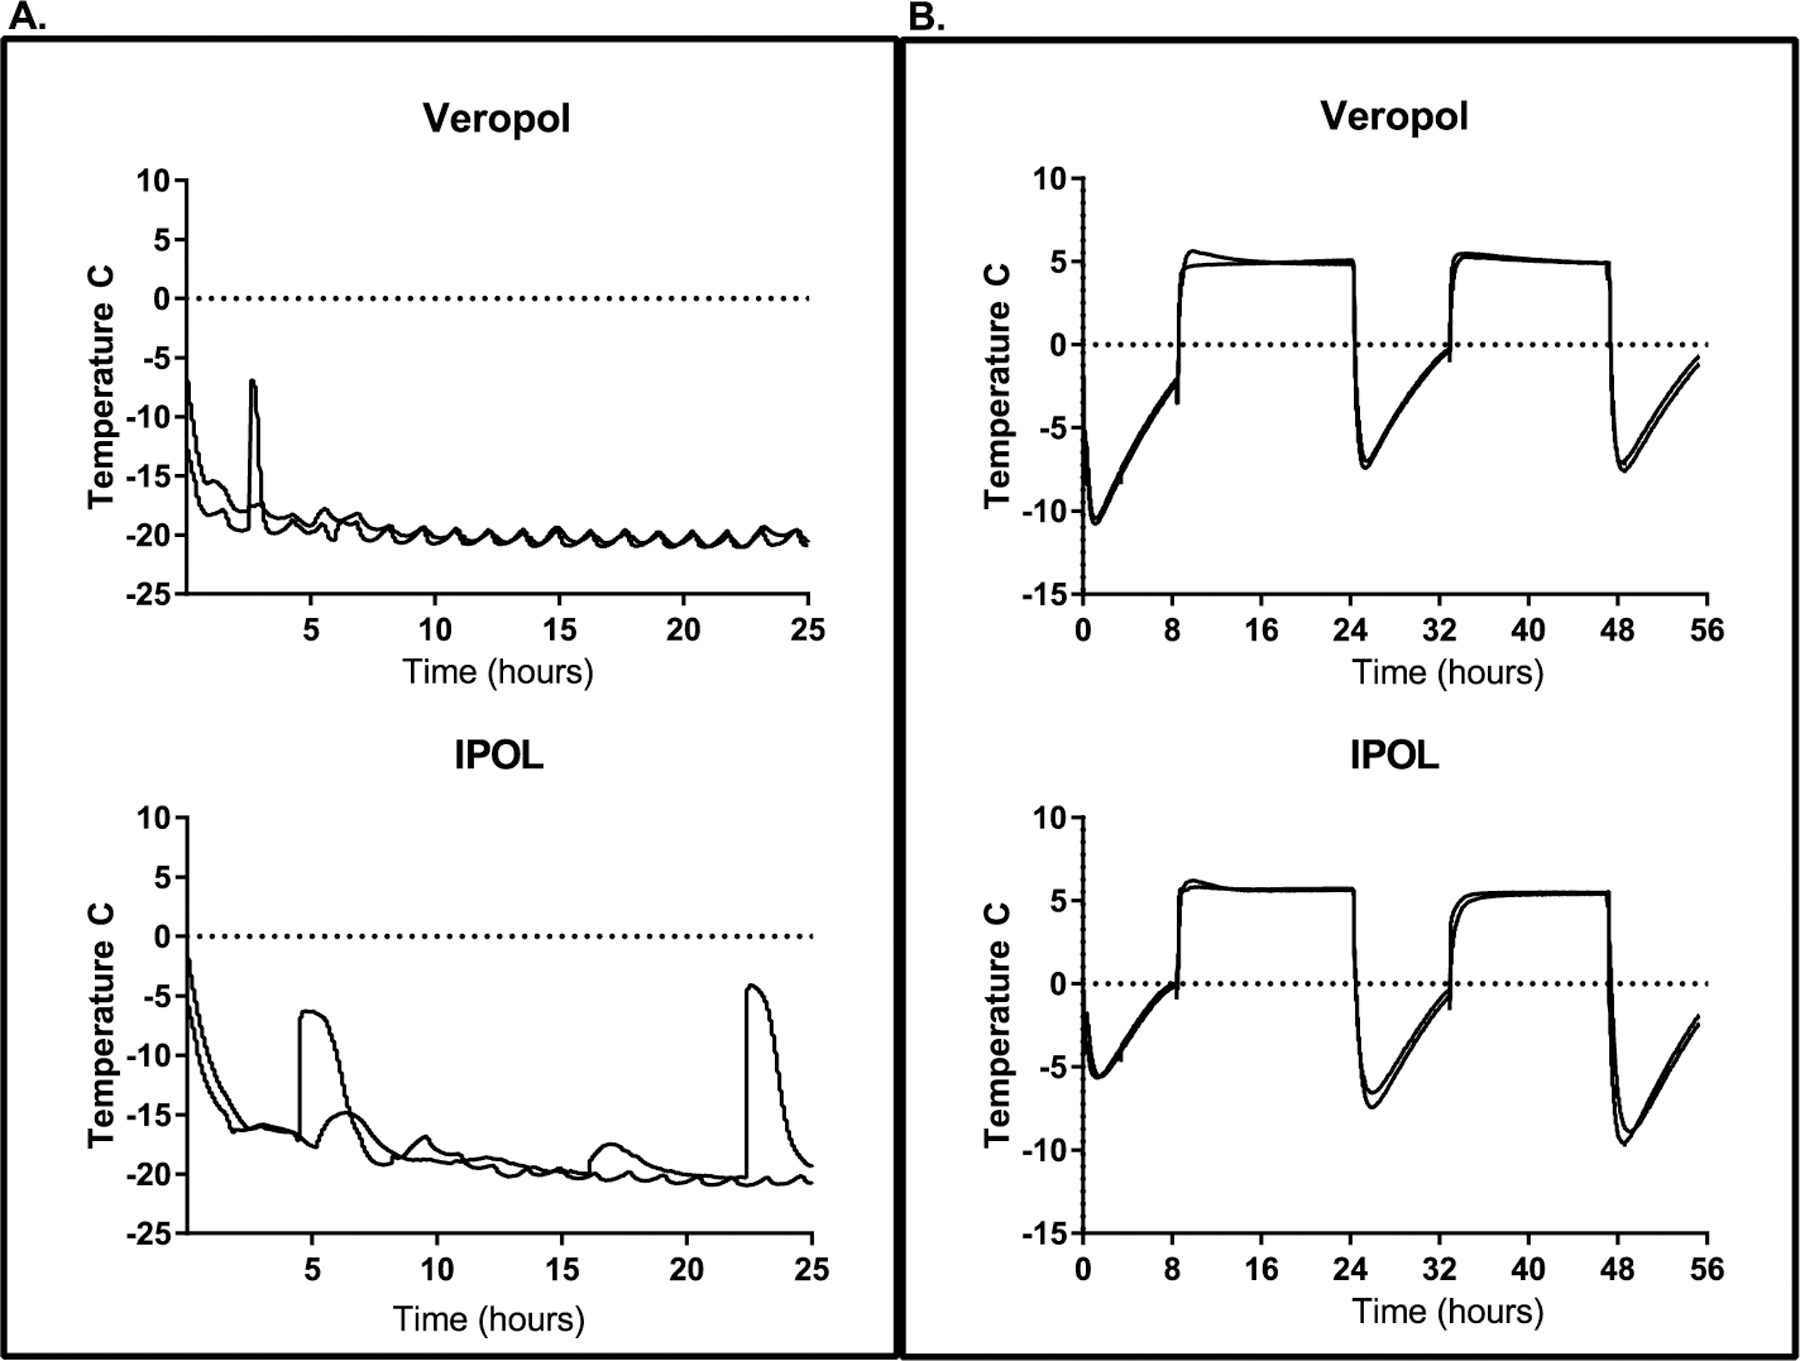
Fig. 2.

Representative freeze profiles from two vaccine vials from each manufacturer. Panel A: Representative graphs for vaccine vial temperatures during the first 24 h of storage freezing conditions (scenario 2). Panel B: Representative graphs for vaccine vial temperatures during transport conditions (scenario 4).
