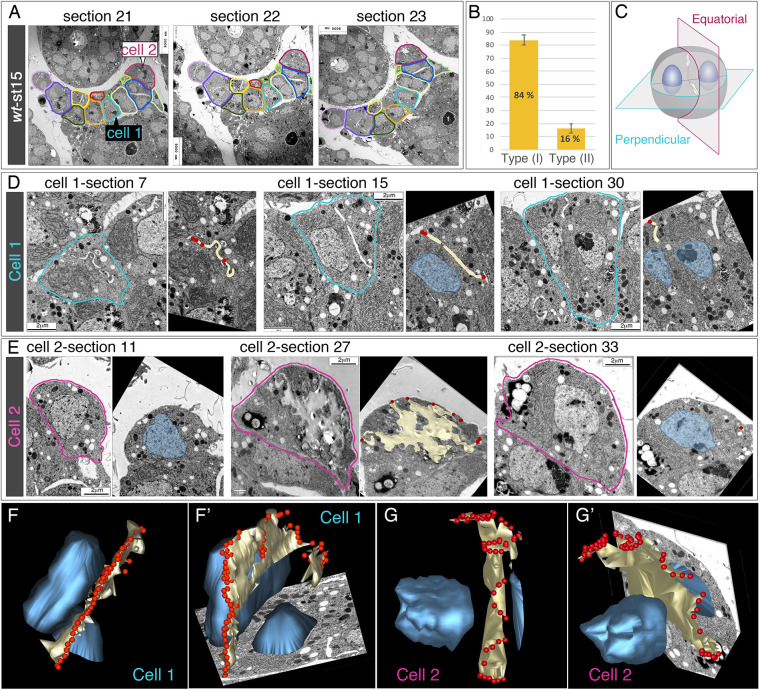
Fig. 2.
3D reconstructions of the distribution of slit diaphragms at the equatorial cortex of binucleated embryonic garland nephrocytes. (A) Selected progressive TEM micrographs from a string of garland nephrocytes at stage 15. Each nephrocyte is outlined in a different colour through the whole series. (B) Quantification of the two types of garland nephrocytes (I and II) found in wild-type embryos (see also Fig. S2). Data are mean±s.e.m. (C) Diagram of cell-sectioning perpendicular to the equatorial plane, cutting the nephrocyte between the two nuclei (these sections include both nuclei, cell 1) or through the equatorial plane (cell 2). (D,E) Selected progressive TEM images and the corresponding segmentations for cells 1 (D) and 2 (E); in the segmentations, nuclei are indicated in blue, lacunae formed by invaginated membranes in yellow and slit diaphragms in red. (F-G′) 3D reconstructions shown from two different viewpoints obtained for cells 1 (F,F′) and 2 (G,G′), showing the lacunae (yellow), the nuclei (blue) and the distribution of the first slit diaphragms assembled (red), which hold together both ends of the invaginated membrane and prefigure a ring that surrounds the cell in its equatorial plane. See also Movies 1-4.

