
figure 3.
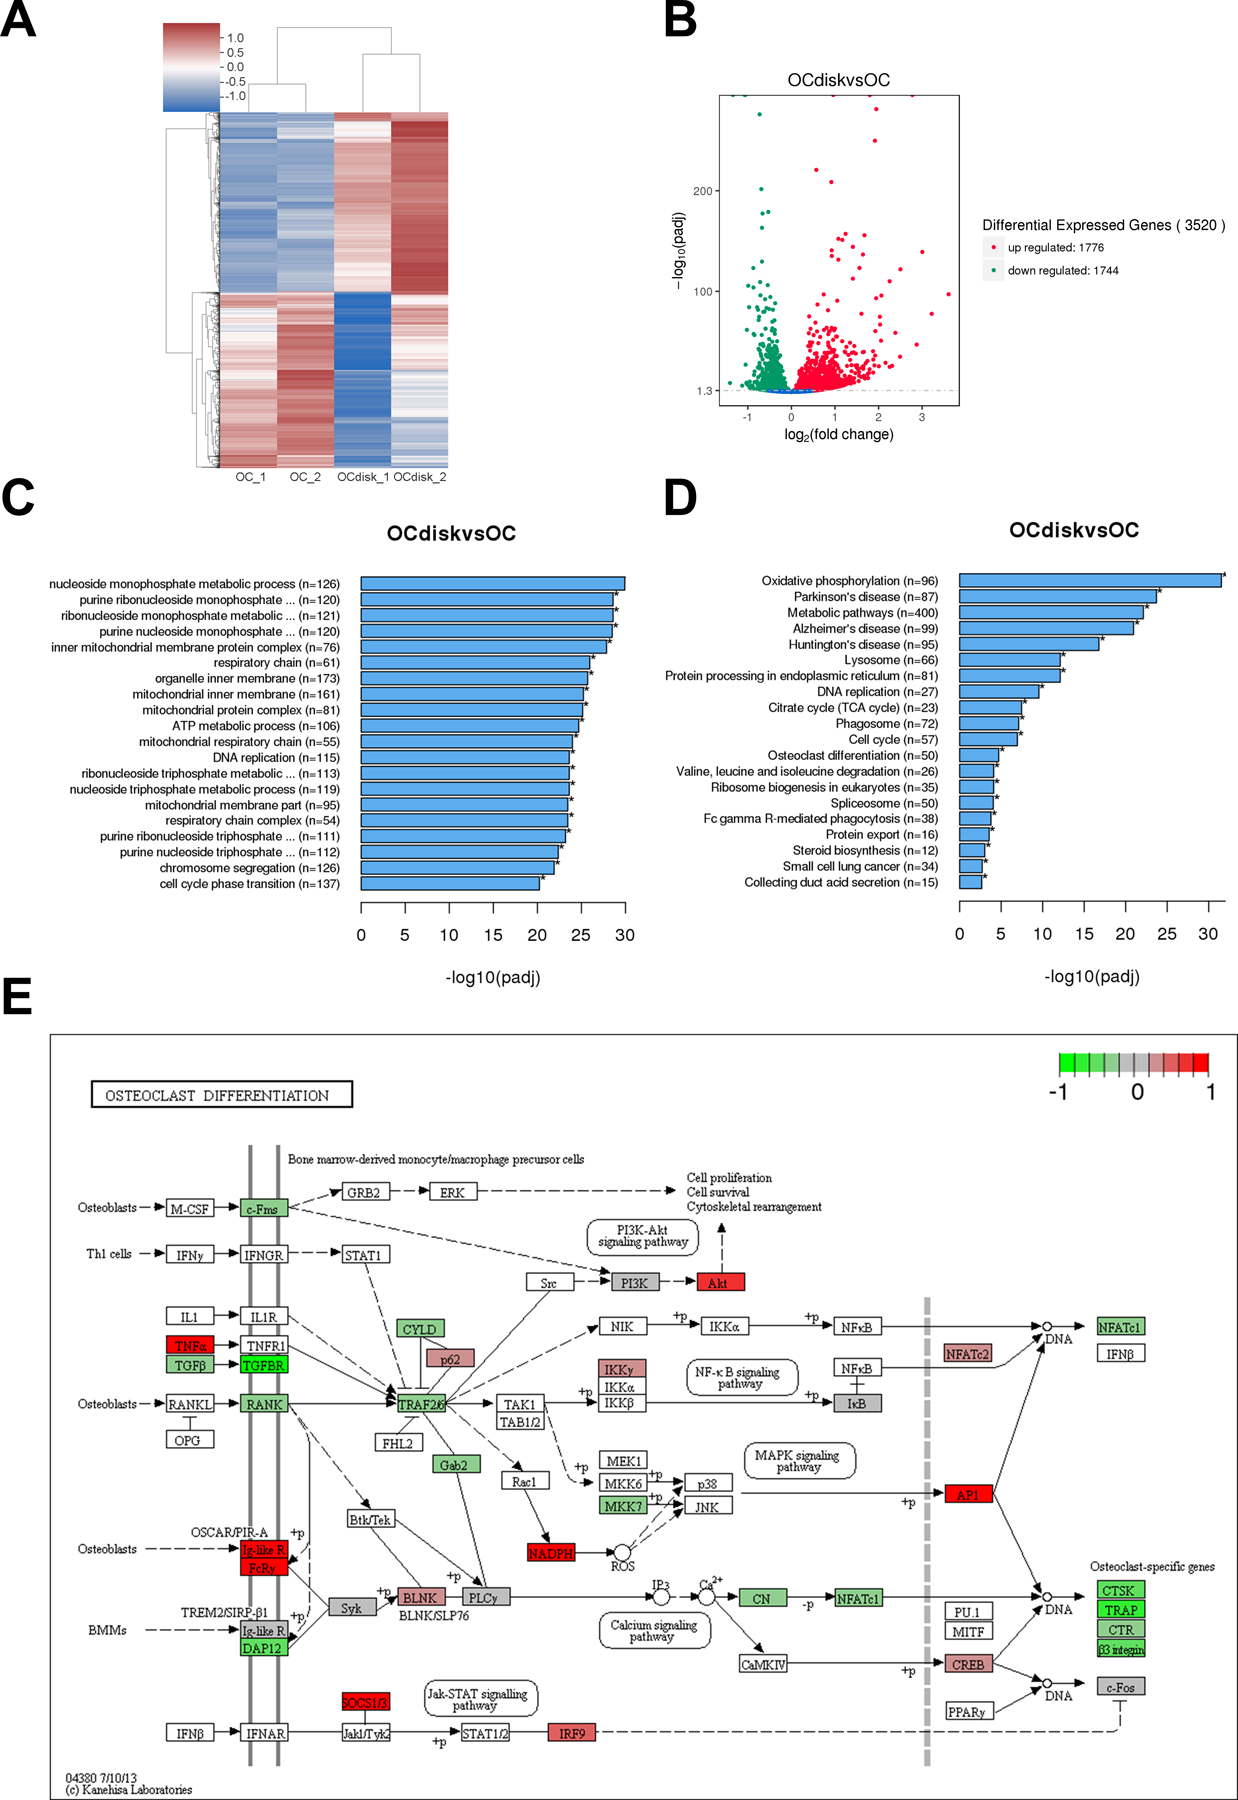
pdhc modifies oc transcriptome profile. raw cells were seeded on tissue culture plates (oc group) or pdhc disks (ocdisk group) and received 10 ng/ml rankl stimulation for 5 days to differentiate into ocs. upon differentiation, ocs were harvested for mrna-seq. (a) hierarchical clustering heatmap of differential expression (de) genes. color key represents z score. red represents high expression genes; blue represents low expression genes. (b) volcano plot of de genes in ocdisk vs. oc group. threshold: padj < 0.05. red dots represent upregulated de genes; green dots represent downregulated de genes. (c) the top 20 enriched go pathways. (d) the top 20 enriched kegg pathways. (e) kegg map (kanehisa laboratories) of de genes in “osteoclast differentiation” pathway in ocdisk vs. oc. color key represents log2fc.