figure 6.

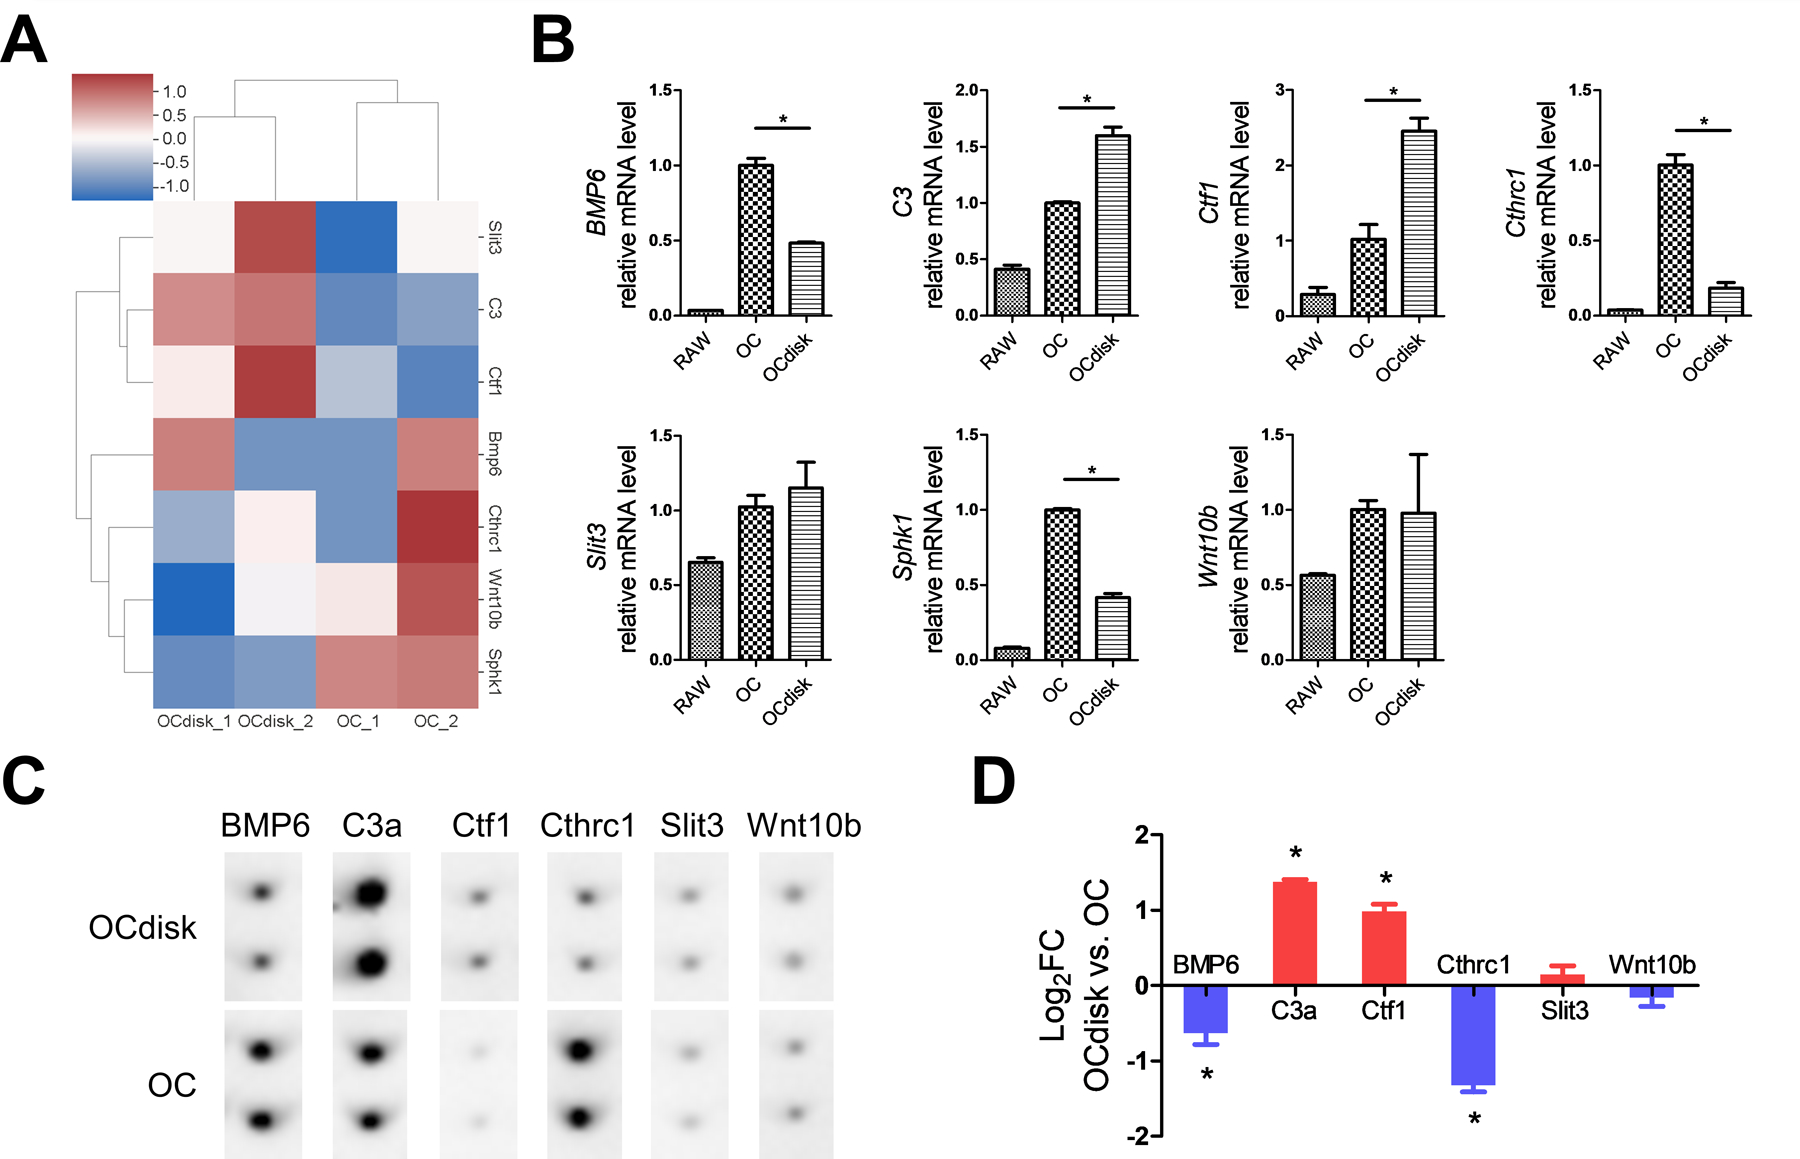
pdhc modifies oc clastokines expression pattern. raw cells were seeded on tissue culture plates (oc group) or pdhc disks (ocdisk group) and received 10 ng/ml rankl stimulation for 5 days to differentiate into oc. (a) hierarchical clustering heatmap of clastokine genes expression; based on mrna-seq data. color key represents z score. red represents high expression genes; blue represents low expression genes. (b) relative expression of clastokine genes determined by rt-qpcr; normalized to b2m. *p < 0.05. (c) antibody array detection of clastokines at the protein level in conditioned medium. (d) quantification result of antibody array. *p < 0.05 ocdisk vs. oc.
n = 2 for all experiments. data shown as mean ± sem.
