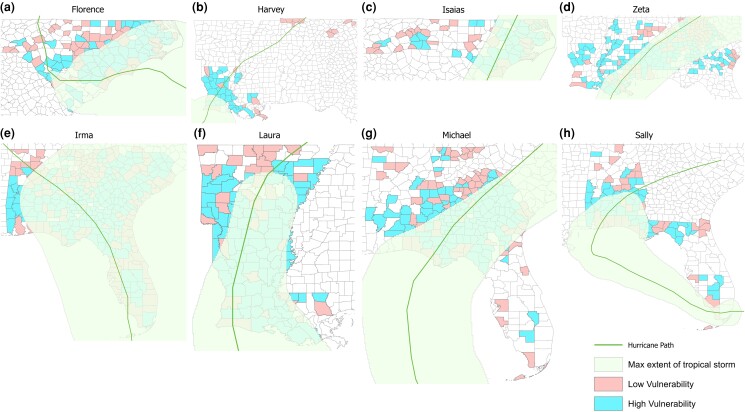
Fig. 2.
a)–h) Storm paths and affected counties for the eight hurricanes. Green line: hurricane path. Shaded green: range of sustained wind speed greater than 34 knots (tropical storm wind level). Blue: high overall social vulnerability (compared with average level of ) counties. Red: low overall social vulnerability (compared with average level) counties.

