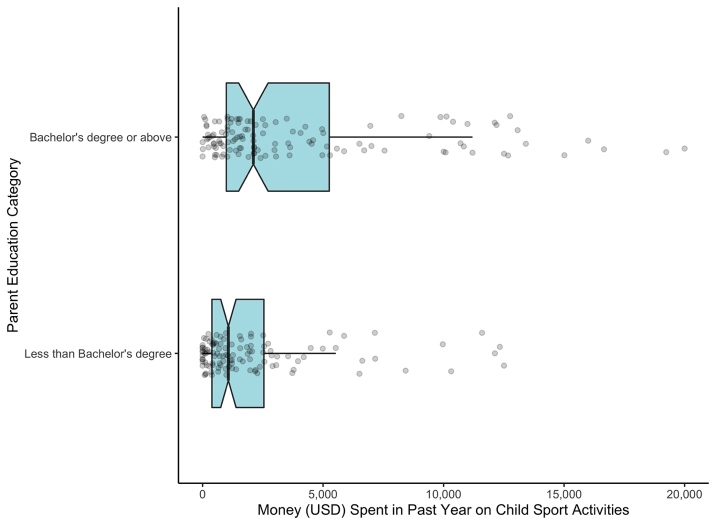
Figure 2. Comparison of money spent in past year on child’s basketball activities between parent education categories.
Presented as a notched box plot, with box representing interquartile range (IQR), whiskers representing range of 1.5 times the IQR, line indicating median, notch displaying 95% confidence interval of the median, and individual data points for each parent.

