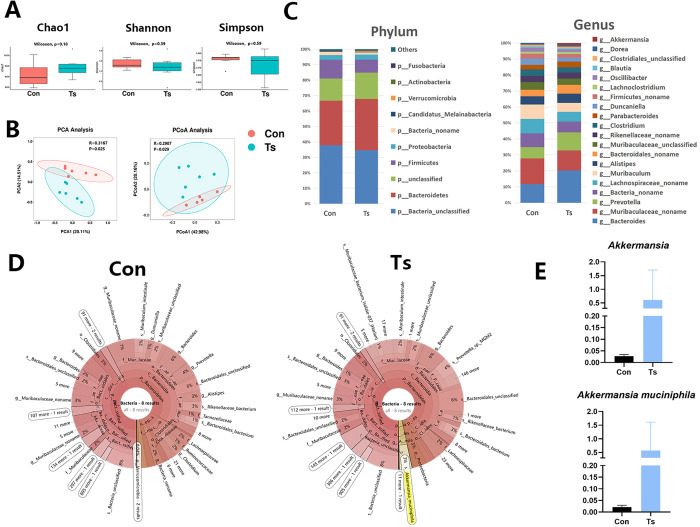
Fig 4. Characterization of the gut microbiota in Ts-infected mice using metagenomic sequencing.
(A) Chao1 index, Shannon index and Simpson index was analyzed by metagenomic. Data are shown as individual data points and mean ± SD. Difference was tested with Wilcoxon signed-rank test. (B) Principal component analysis (PCA) and principal coordinates analysis (PCoA) plot (β diversity) in the microbiota from the controls (Con) (n = 6) and Ts-infected mice (n = 6). (C) Phylum-level and genus-level median relative abundances of Con and Ts group. (D) Krona plot of identified bacteria species of Con and Ts group. (E) Comparison proportion of genus and species levels of Akkermansia muciniphila based on metagenomics.

