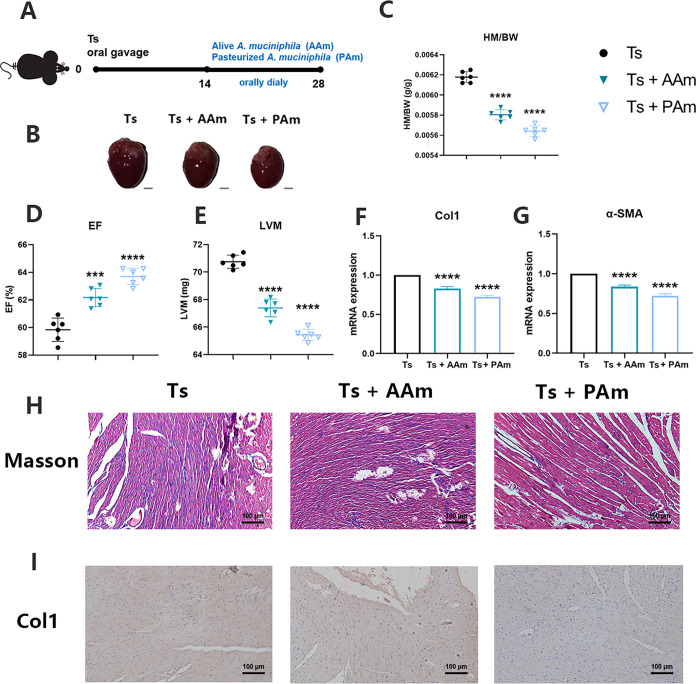
Fig 5. Both alive and pasteurized Akkermansia muciniphila had beneficial effect on helminth-induced cardiac fibrosis.
(A) Experimental scheme of alive or pasteurized A. muciniphila administration (8 × 10⁸ CFU per dose orally) after Ts infection. (B) Whole heart images of Ts-infected mice (Ts) (n = 6) and Ts-infected mice treated with alive A. muciniphila (Ts+AAm) (n = 6) or pasteurized A. muciniphila (Ts+PAm) (n = 6). Representative images are shown. (C) Heart mass-to-body weight ratio (HM/BW). (D and E) Ejection fraction (EF) and left ventricular weight (LVM) obtained by cardiac ultrasound. (F and G) qPCR analysis of Collagen-1 (Col1) and α-SMA expression in the heart tissue of mice. (H and I) Masson staining and Col1 immunohistochemistry results of heart tissues. Magnification, 200×. Scale bars, 100 μm. Representative images are shown. Data are shown as individual data points and mean ± SD. Data were compared by one-way ANOVA followed by Tukey multiple comparison tests. ns, not significant; *, p < 0.05; **, p < 0.01, ***, p <0.001, ****, p <0.0001.

