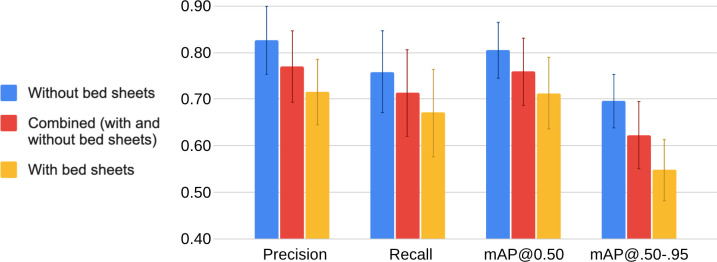
Fig 3. Grouped bar charts of performance parameters from the testing phase (precision, recall, mAP@0.50, and mAP@.50-.95) averaged across the six models’ testing sets and across all classes, where the parameters are presented under three conditions.
(1) Red bar: averaged across all classes as a combination of the “with bed sheets” and “without bed sheets” conditions (24 classes). (2) Blue bar: averaged across all classes under the “without bed sheets” condition (12 classes). (3) Yellow bar: averaged across all classes under the “with bed sheets” condition (12 classes). The error bars represent one standard deviation of the respective value across all measures, which reflects the variability both across models and classes.

