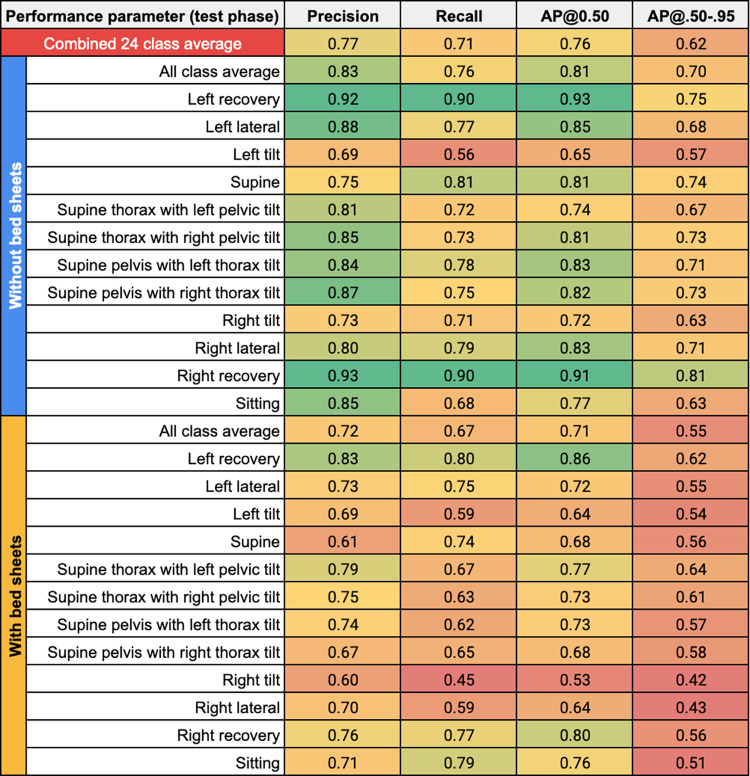
Fig 4. Heatmap of precision, recall, AP@0.50, and AP@.50-.95 (columns) from the testing phase averaged across the six models’ test sets for each of the predicted classes (rows) under the “without bed sheets” (upper blue row header) and “with bed sheets” condition (lower yellow row header).
The value of the respective performance parameter is mapped to a color spectrum from red to yellow to green where values of 0.50 or less are represented by red at the lower end of the spectrum, values around 0.75 are shades around yellow (oranger if lower than 0.75; greener if higher than 0.75), and values of 0.90 or more are represented by green at the higher end of the spectrum. The “all class average” is provided as the averaged value of the respective performance parameter across the six models’ test sets and the 12 classes under each bed sheets condition, and the “combined 24 class average” is given (red column) as the average of the former two values combined. For the “all class average” rows, the value in the AP@0.50 column is the mAP@0.50, and the value in the AP@.50-.95 column is the mAP@.50-.95 since these values represent averages across multiple classes.

