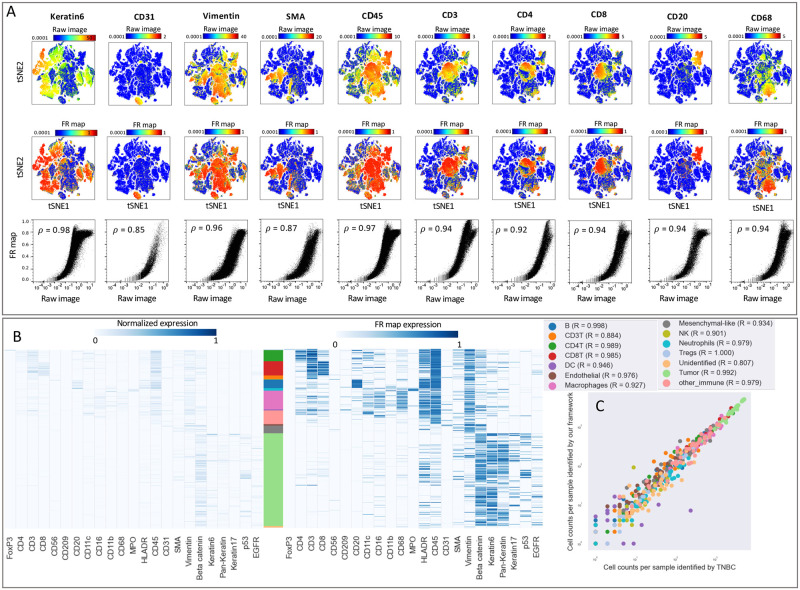
Fig 3. Our framework delineates cell type compositions in mass ion beam imaging data consistent with MAUI [2].
A: Marker expression measured per cell using the images (top row) and the FR maps (middle row) are overlaid on the tSNE plot for selected immune and tumor markers. The bottom row demonstrates correlation between marker expression per cell from raw images (x-axis) and FR maps (y-axis). The strength of these correlations are quantified using Spearman’s rank correlation coefficient. B: Marker expression is shown for cells clustered according to the TNBC study [2] and sorted by cell phenotype. Expression values for each marker are scaled from zero to one (left) or are measured from the FR maps (right). Stacked bar plot shows the abundance of each cell type in the dataset, with corresponding colors specified in the legends of panel C. C: Correlation between the frequency of each cell type per patient identified using MAUI in the TNBC study (x-axis) and our proposed framework (y-axis). Pearson coefficient is calculated for each cell type.

