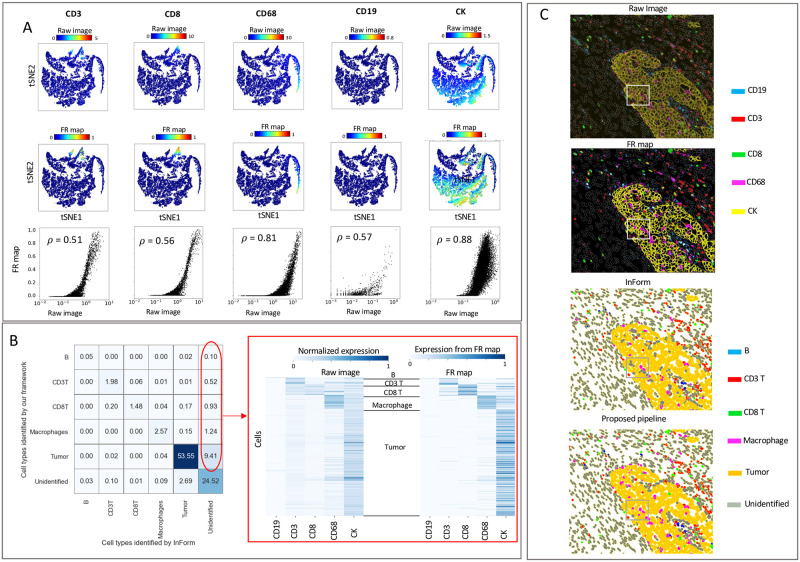
Fig 4. Our framework delineates cell-type composition in fluorescence imaging data consistent with inForm.
A: Signal intensities for selected immune and tumor markers measured for individual cells using the raw images (top row) or the FR maps (middle row) were overlaid on tSNE plots. Scatter plots (bottom row) demonstrating the correlation between signal intensity per cell from raw images (x-axis) and FR maps (y-axis). The strength of these correlations are quantified using Spearman’s rank correlation coefficient. B: Cell-cell comparison between the cell type identified by inForm (x-axis) and our framework (y-axis). Table entries indicate the percentage of cells in the dataset to compare the identified cell types by the baselines (columns) and our framework (rows). Heatmap of marker expression for the unidentified cluster by inForm (right); the expression level of markers per cell is measured using the raw image scaled between 0 and 1 (left) or measured from FR maps (right). In both heatmaps the expression level is computed as the summation of pixel values within the boundary of a cell divided by the total number of pixels comprising that cell. C: Color overlay of markers CD19, CD3, CD8, CD68, and CK (top); plots compare the stain from the raw image with the corresponding FR map (top). Pseudo-coloring of cell populations compares the predicted cell types by inForm with our framework (bottom).

