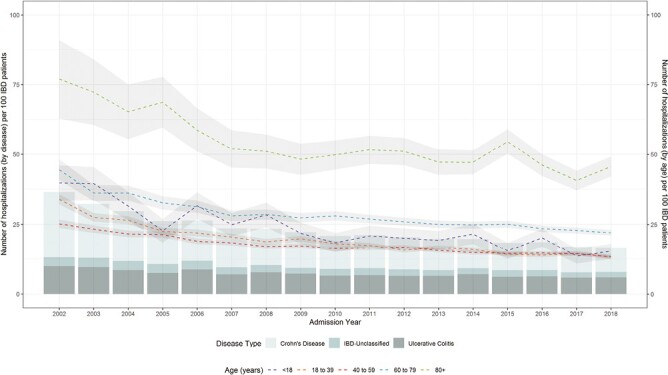
Figure 1.

Age- and sex-standardized all-cause IBD hospitalization rates per 100 IBD patients stratified by age groups and disease type. The scale on the left refers to the summative bar graphs representing the distribution of disease type; the scale on the right refers to the line graphs representing the hospitalization rates by age group.
