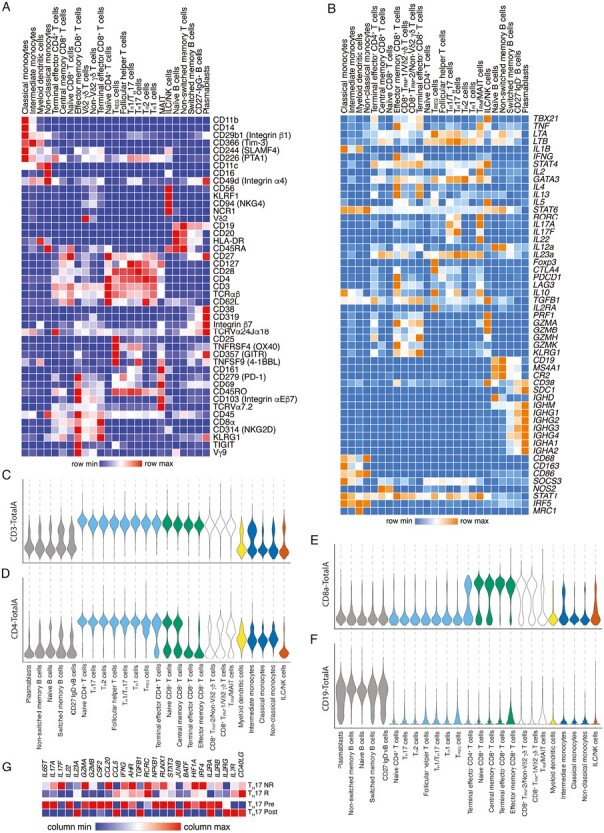
Figure 2.

Expression of canonical genes and proteins in annotated immune cell subsets. A, Relative expression of selected proteins included in the CITE-seq antibody panel, represented as a hierarchically clustered summary heatmap; columns represent each of the 25 annotated immune cell subsets, and rows represent individual proteins. B, Relative expression of selected canonical genes, represented as a hierarchically clustered summary heatmap; columns represent each of the 25 annotated immune cell subsets and rows represent selected genes. C-F, Expression of selected proteins in each of the 25 annotated immune cell subsets, represented as violin plots, ordered, and colored by major immune cell type (gray, B cells; light blue, CD4+ T cells; green, CD8+ T cells; black outline, tissue-resident/unconventional T cells; yellow, myeloid cells; blue, monocytes; brown, ILC/NK cells. G, Relative expression of selected genes related to TH17 function and regulation comparing colon TH17 from vedolizumab nonresponders, vedolizumab responders, single subject pretreatment, and single subject post-treatment, represented as a summary heat map; columns represent selected genes and rows represent the samples.
