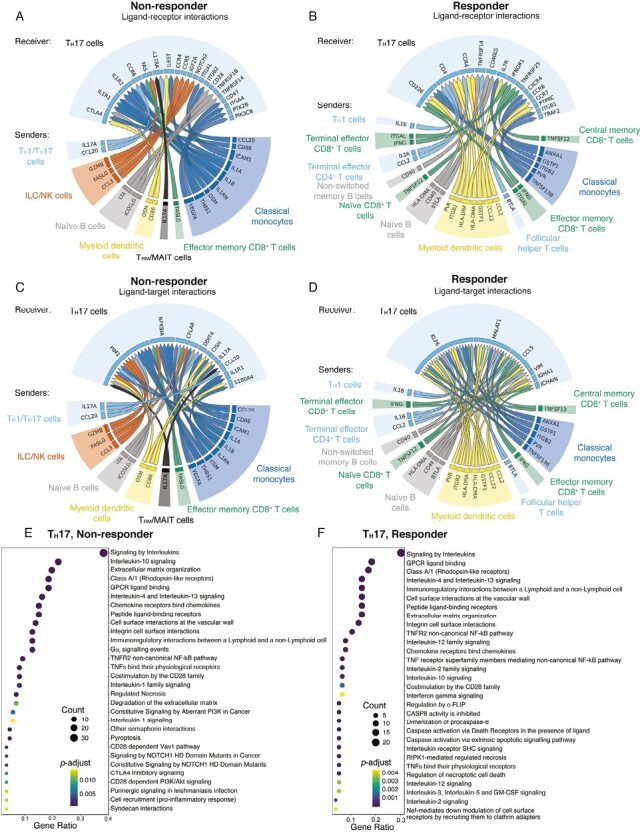
Figure 3.

NicheNet analyses of colon TH17 cell interactions with other immune cells in vedolizumab nonresponders vs responders. A-B, Putative ligand-receptor pairs on “sender” immune cells and “receiver” cell (TH17), represented as Circos plots, in nonresponders and responders. Colors indicate major immune cell type. Specific immune cell subsets are labeled around the Circos plot. C-D, Genes predicted to be induced in TH17 cells by predicted ligand-receptor interactions, represented as Circos plots, in nonresponders and responders. E-F, Pathway analyses of enriched genes downstream of predicted ligand-receptor pairs represented as reactome plots in nonresponders and responders.
