Figure 2.
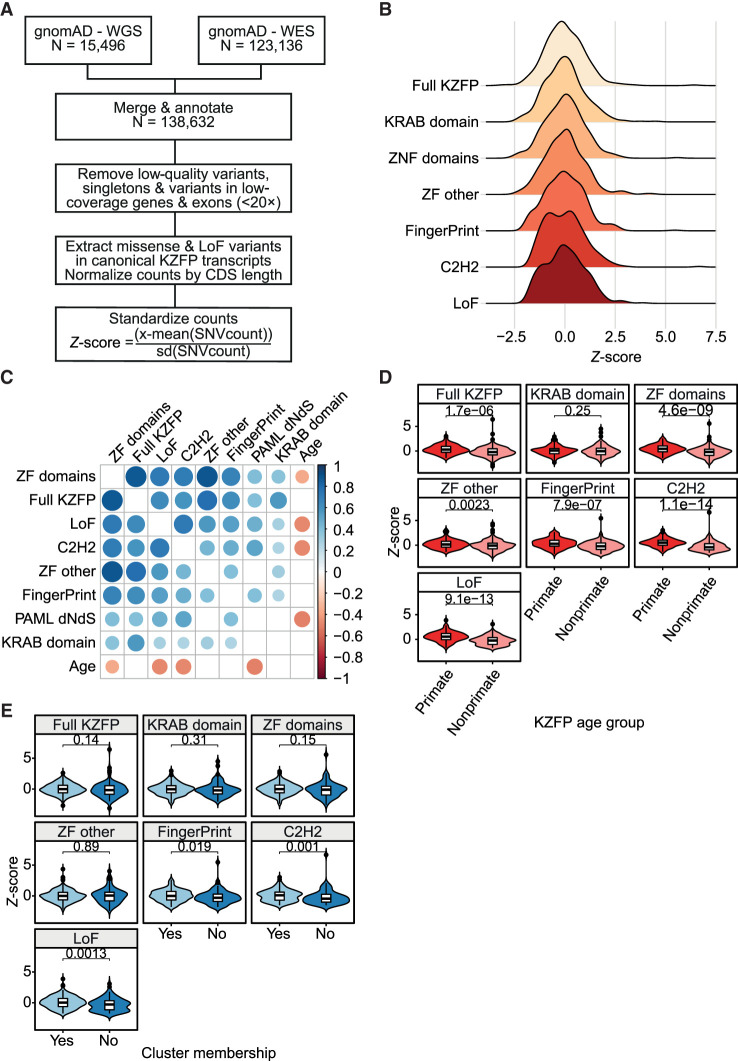
Coding constraints of KZFP genes. (A) Schematic of genetic constraint Z-score calculation. WGS/WES, whole genome/exome sequencing; LoF, loss-of-function variant; CDS, coding sequence. (B) Distribution of indicated Z scores; a lower score indicates increased constraint compared to the average of all KZFPs. Full KZFP, all variants within the canonical KZFP transcript; KRAB domain, only variants in the KRAB domain; ZF domains, variants within the ZF domains; ZF other, variants in nonfunctional positions within the ZF domains; FingerPrint, variants in the ZF fingerprint positions; C2H2, variants in the cysteine or histidine positions of the ZF domains; LoF, loss-of-function variants. (C) Correlation plot showing the Spearman's correlations between: the Z scores defined in B, level of natural selection (PAML dN/dS), and estimated age of KZFPs. The colors and their intensity represent the direction and strength of the correlations, with blue representing a positive and red a negative correlation. Only significant correlations after Bonferroni correction are shown. (D) Primate versus nonprimate KZFP constraint across indicated KZFP domains or residues. (E) Relative constraint of indicated regions for KZFPs inside versus outside clusters. P-values were calculated using the Wilcoxon rank-sum test (WRS).

