Figure 3.
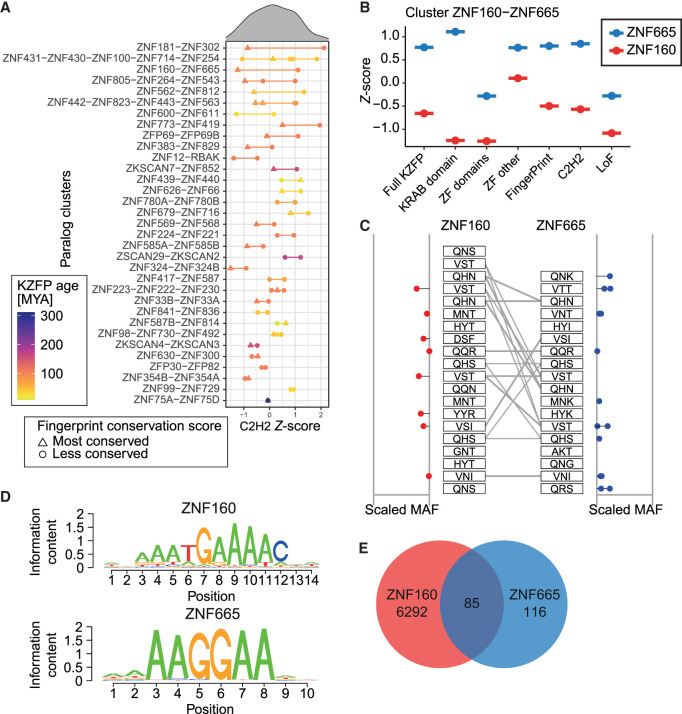
Coding constraints of KZFP paralogs. (A) Distribution of C2H2 constraint Z scores for indicated sets of KZFP paralogs, arranged from top to bottom according to difference within pairs. Each KZFP is colored according to their respective age, with the line separating them colored as the mean age of the pair. The paralog within each pair with the most conserved fingerprint across evolutionary time is marked by a triangle, whereas less or identically conserved KZFPs are marked by a dot. The order of the y-axis labels corresponds to the order of the colored points on the graph. (B) Differential constraint Z scores for indicated domains of paralogs ZNF160 and ZNF665. (C) Zinc fingerprints of ZNF160 and ZNF665 with the scaled minor allele frequency (MAF) of identified missense variants indicated on the sides. Gray lines indicate identical zinc fingerprints. (D) Consensus DNA binding motifs of ZNF160 and ZNF665. (E) Venn diagram of ChIP-exo peaks of ZNF160 and ZNF665 in HEK293T cells.

