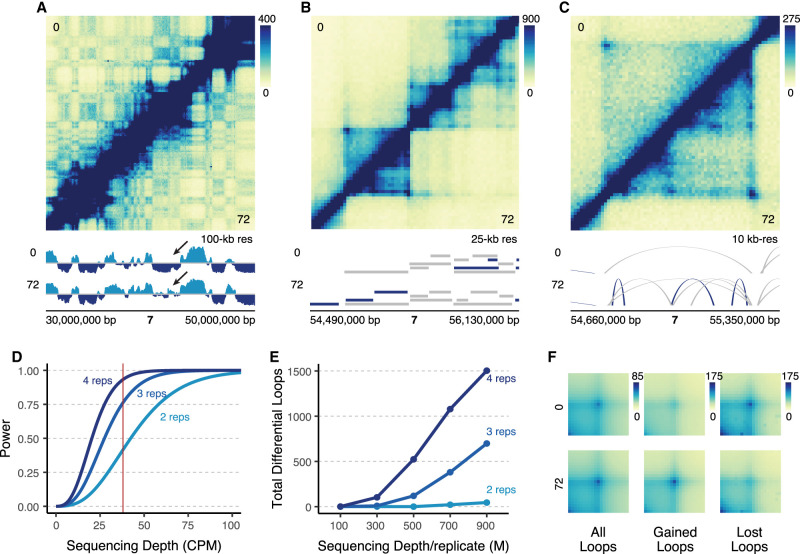
Figure 1.
Deeply sequenced Hi-C experiments provide sensitive detection of differential chromatin loops. (A) 20 Mb region on Chromosome 7 at 100-kb resolution comparing K562s at 0 h (top) to differentiated megakaryocytes at 72 h (bottom). Signal tracks show compartmental eigenvector calls (light blue = compartment A, dark blue = compartment B). The arrow points to qualitative changes in compartmentalization. (B) Zoom-in of a 1.6 Mb region of Chromosome 7 at 25-kb resolution. TAD calls are indicated by ranges below the Hi-C map for each cell type (dark blue = cell type–specific, gray = shared across cell types). (C) Zoom-in of a 690 kb region in B at 10-kb resolution showing a region with differential loops. Arches indicate loop calls (dark blue = cell type–specific, gray = shared across cell types). (D) Statistical power modeled across various theoretical sequencing depths at two, three, and four biological replicates. Red line indicates the median sequencing depth per loop (CPM: counts per million). (E) Actual number of differential loops called at multiple different subsampled sequencing depths for different numbers of replicates (M: millions). (F) Aggregate peak analysis for all loops, gained loops, and lost loops.

