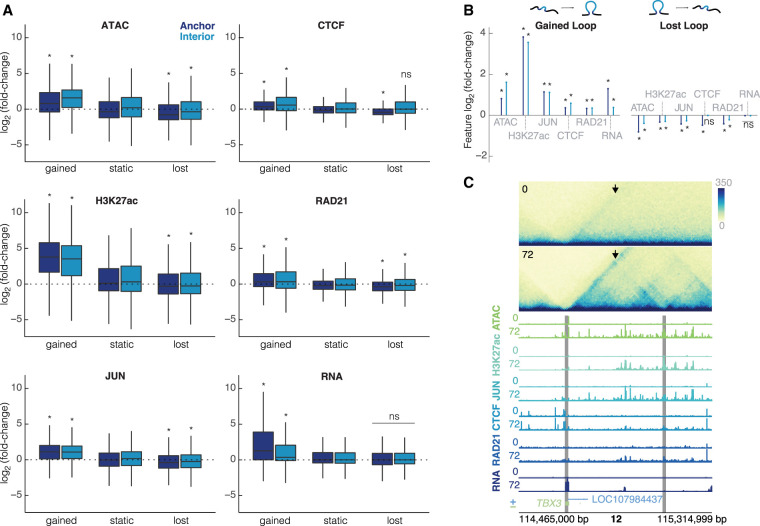
Figure 3.
Changes in chromatin features are correlated with changes in looping. (A) Intersections of each feature at the loop anchors and interior for gained, static, and lost loops (dark blue = anchor, light blue = interior). All plots are on the same scale for the y-axis, showing log2(fold-change). Wilcoxon rank-sum test was performed for each feature to compare gained/lost anchors to static anchors and gained/lost interiors to static interiors; asterisks represent P < 0.05. (B) Median unshrunken log2(fold-change) of each data set at gained loops (left), and lost loops (right). Asterisks represent P < 0.05, dots represent P > 0.05. (C) 600-kb region around a loop at the TBX3 locus at 10-kb resolution. The arrow is pointing to the gained loop. Signal tracks for ATAC-seq, H3K27ac, JUN, CTCF, RAD21, and RNA for K562s at 0 h and differentiated megakaryocytes at 72 h show increased occupancy for all features. Gray bars indicate 10-kb loop anchors.

