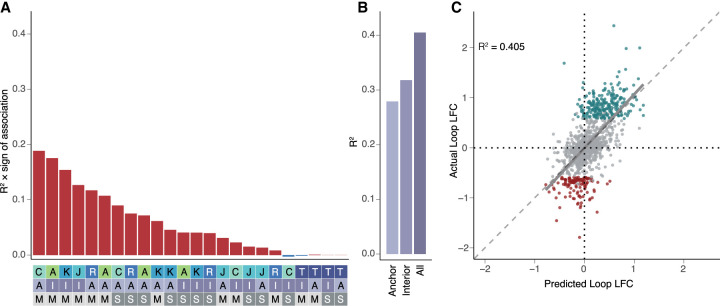
Figure 4.
Changes in chromatin features predict changes in chromatin looping. (A) R2 multiplied by the sign of association for all possible features correlated individually against changes in all loops in the model (top). Heatmap (bottom) is a legend in which the feature, position, and measure for each bar are reported (features: A = ATAC, K = H3K27ac, J = JUN, C = CTCF, R = RAD21, T = RNA; positions: A = anchor, I = interior; measures: M = max, S = sum). (B) R2 values calculated for the anchor only, interior only, or all feature models. (C) Scatterplot showing the predicted loop fold-change versus actual loop fold-change for the testing data set for looping. (Gray = static loops, teal = gained loops, maroon = lost loops, R2 calculated for all loops included in the testing data set.)

