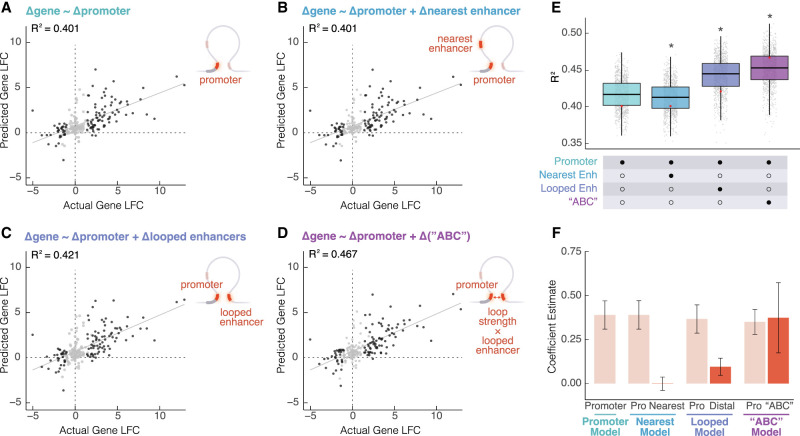
Figure 5.
Changes in gene expression are explained by combined proximal and distal enhancer activity and loop strength. Scatterplots showing predicted gene fold change versus actual gene log2(fold-change) (LFC) based on one permutation of (A) promoter H3K27ac LFC alone, (B) promoter H3K27ac LFC and the nearest enhancer to the promoter's LFC, (C) promoter H3K27ac LFC and distal looped H3K27ac, and (D) promoter H3K27ac LFC and the modified ABC LFC (dark gray = differential gene, light gray = static gene). (E) R2 for each model calculated based on 1000 permutations of splitting the data into training and testing sets. A Wilcoxon rank-sum test was performed to compare each group to the promoter only model; asterisks represent P < 0.05. Red dots represent the single permutation from A–D. (F) Estimates for each term in each model were calculated based on 1000 permutations of splitting the data into training and testing sets.

