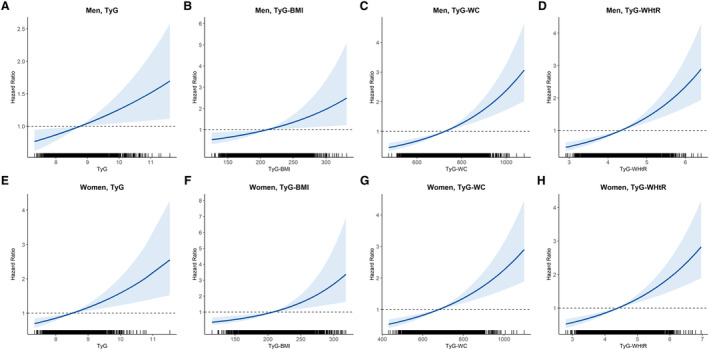
Figure 2. Cox proportional hazards curves showing changes in hazard ratios for incident hypertension with TyG, TyG‐BMI, TyG‐WC, and TyG‐WHtR values.

Relationship between incident hypertension in men and TyG tertile (A), TyG‐BMI (B), TyG‐WC (C), and TyG‐WHtR (D). Relationship between incident hypertension in women and TyG tertile (E), TyG‐BMI (F), TyG‐WC (G), and TyG‐WHtR (H). The x axis is a value of TyG or modified TyG, and y axis is the hazard ratio corresponding to the x axis value relative to the mean value of TyG or modified TyG. In each panel, the blue line denotes the estimated hazard ratio, and gray shading indicates the 95% confidence intervals. BMI indicates body mass index; TyG, triglyceride‐glucose index; TyG‐BMI, TyG index×BMI; TyG‐WC, TyG index×WC; TyG‐WHtR, TyG index×WHtR; WC, waist circumference; and WHtR, waist‐to‐height ratio.
