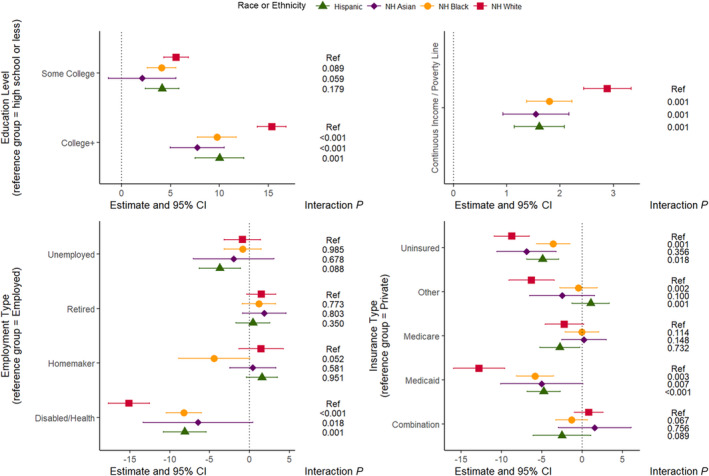
Figure 2. The association of education level with Life's Essential 8 cardiovascular health scores by race and ethnicity, with race and ethnicity interaction P values listed.

Plotted estimates and CI are from age‐adjusted linear models (Table S4). Interaction P values (interaction P) are from race×socioeconomic status factor interaction terms in the age‐adjusted linear models. Interpretation: there is a significantly greater magnitude of positive association of education level with Life's Essential 8 among non‐Hispanic White Americans than other groups (likelihood ratio test P<0.001). There is a significantly greater magnitude of positive association of income level with Life's Essential 8 among non‐Hispanic White Americans than other groups (likelihood ratio test P<0.001). There is a significantly greater magnitude of negative association of having a disability or health issue that prevents work with Life's Essential 8 among non‐Hispanic White Americans than other groups (likelihood ratio test P<0.001). There is a significantly greater magnitude of negative association of having Medicaid insurance with Life's Essential 8 among non‐Hispanic White Americans than other groups (likelihood ratio test P<0.001). NH indicates non‐Hispanic.
