
Figure 2. Changes in LVEF and BNP.
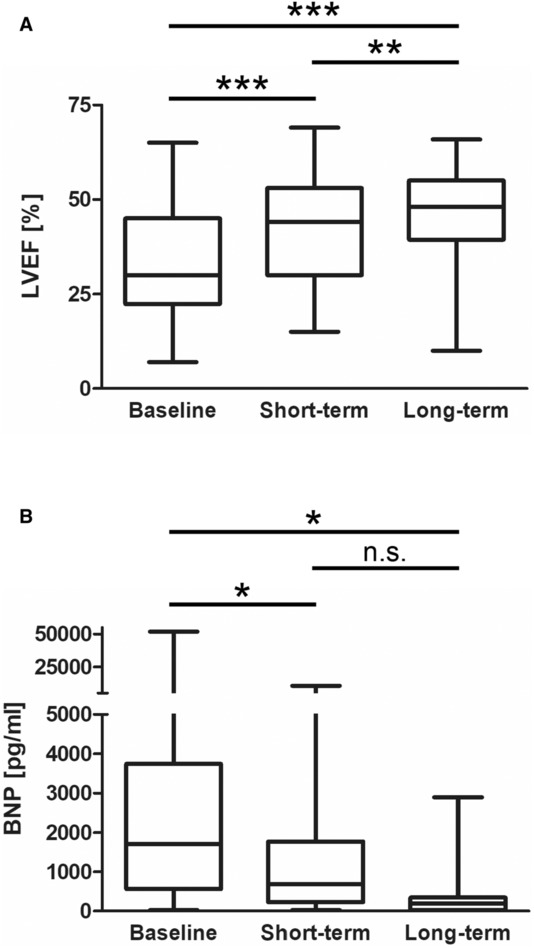
A, Box‐whisker plot of LVEF at baseline (n=124), short‐ (n=105) and long‐term (n=67) follow‐up. B, Box‐whisker plot of BNP levels at baseline (n=58), short‐ (n=35), and long‐term (n=15) follow‐up. Boxes represent median and 25th–75th percentiles. Whiskers show minimum and maximum values. For statistical comparison a linear mixed effect model was used. A 2‐sided P value <0.05 was considered statistically significant. *P<0.05; **P<0.01; ***P<0.001. BNP indicates brain natriuretic peptide; LVEF, left ventricular ejection fraction; and n.s., not significant.