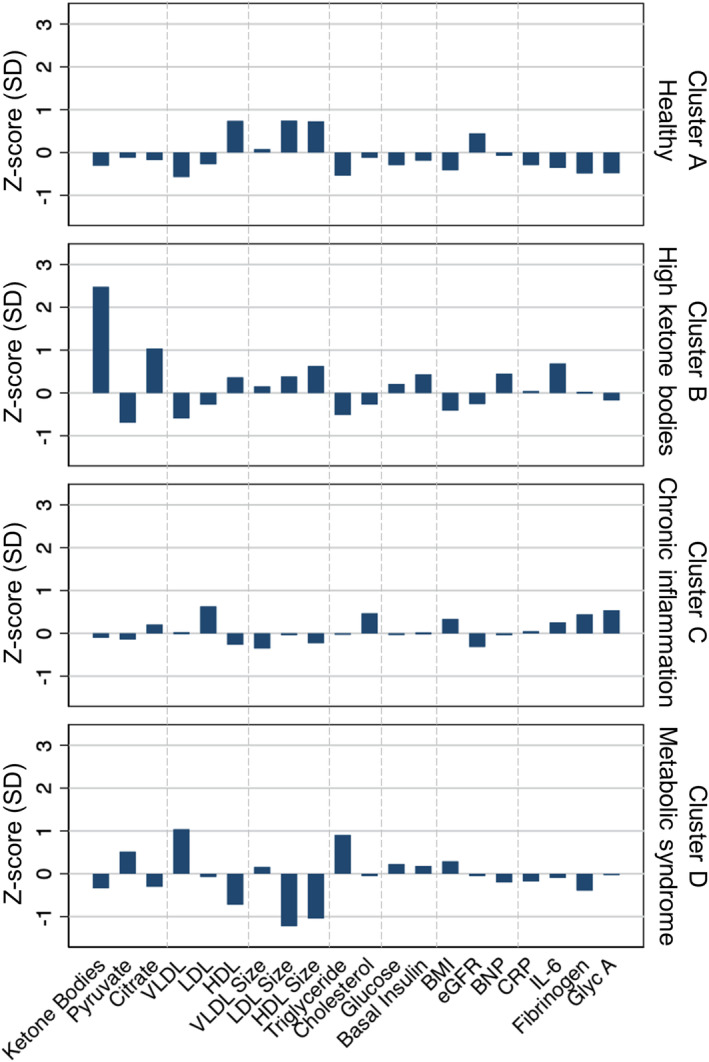
Figure 1. Clustering analysis of metabolic phenotypes.

Data are presented as Z‐score, calculated by the difference from the mean divided by the SD. Four clusters are identified using K‐means clustering analysis of ketone bodies, pyruvate, and citrate, along with biomarkers of metabolic and inflammatory phenotypes, including very low‐density lipoprotein (VLDL), low‐density lipoprotein (LDL), and high‐density lipoprotein (HDL) particle concentrations and sizes, levels of triglyceride, total cholesterol, glucose, basal insulin, BNP (B‐type natriuretic peptide), CRP (C‐reactive protein), IL‐6 (interleukin‐6), fibrinogen, and glycoprotein acetylation (Glyc A), as well as body mass index (BMI) and estimated glomerular filtration rate (eGFR). Probable cluster phenotypes are assigned on the basis of biomarker profiles: cluster A, healthy; cluster B, high ketone bodies; cluster C, chronic inflammation; and cluster D, metabolic syndrome.
