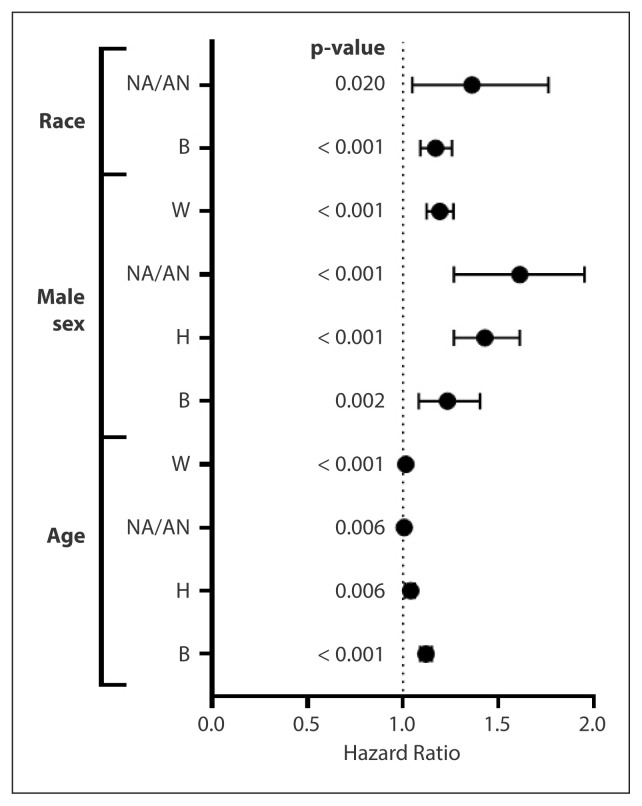
Figure 2.
Hazard ratios (HRs) of Black (B) (HR = 1.17) and Native American/Alaska Native (NA/AN) (HR = 1.36) compared to White race (W); HR of male sex compared to female for W (HR = 1.611), NA/AN (HR = 1.611), Hispanic (H) (HR = 1.428), and B (HR = 1.232) race; HR of increased age of 1 year for W (HR = 1.015), NA/AN (HR = 1.006), H (HR = 1.004), and B (HR = 1.012) race

