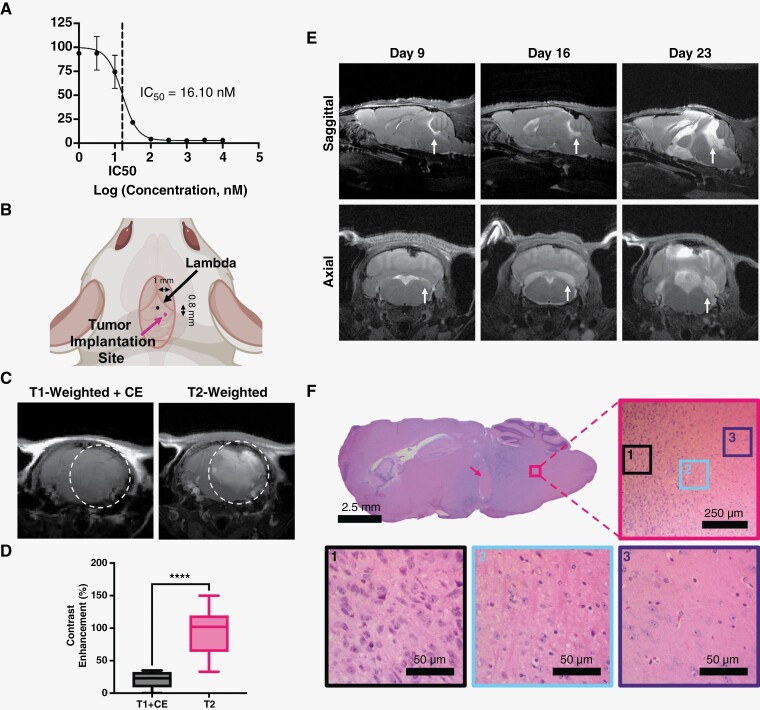
Figure 2.
Diffuse intrinsic pontine glioma BT245 PDX model. (A) Cell viability of BT245 cells treated with panobinostat for 72 h assessed by MTS assay. Vertical dotted line represents IC50. Values represent the mean ± standard deviation (n = 3). (B) Cartoon of tumor implantation site with respect to Lambda skull landmark. (C) T1w contrast-enhanced (CE) MR image (left) prior to FUS/MB showing little tumor enhancement in the T2w MR detectable tumor (right). (D) Quantification of contrast enhancement between the 2 MRI imaging modes (n = 9). (E) T2w MR images at 9, 16, and 23 days post-tumor implantation in the control group. Images show intrusive tumors at the pontine region with growth that progresses to the ventricles and adjacent brain structures. (F) Histological analysis of tumor at 3 weeks post-tumor implantation. Full view of H&E staining shows whole tumor region, with pink arrow illustrating region of necrosis. Figure is zoomed in to a region on the border of tumor (pink border) and healthy tissue. Also shown are zoomed regions of the tumor (black border), margin (blue border), and healthy tissue (purple border). Abbreviations: MR = magnetic resonance; T1w = T1-weighted; T2w = T2-weighted; H&E = hematoxylin and eosin. IC50 = half-maximal inhibitory concentration.

