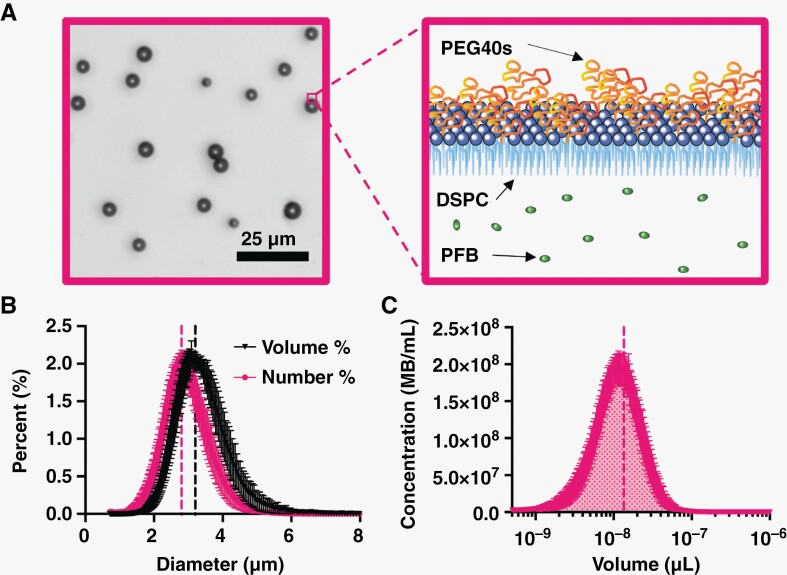
Figure 3.
Microbubble characterization. (A) Brightfield image of 3 µm-diameter microbubbles (left). Cartoon of microbubble structure showing lipid, PEG brush, and internal gas (right). (B) Number- and volume-weighted size distributions. (C) Microbubble concentration against microbubble volume at a basis concentration of 1010 MBs/mL; shaded area under the curve represents the gas volume fraction. Vertical dotted lines represent mean values for both B and C. Data points represent the mean ± standard deviation (n = 8). Abbreviations: PEG = polyethylene glycol; PEG40s = PEG40 stearate; DSPC = distearoylphosphatidylcholine; PFB = perfluorobutane; MB = microbubble.

