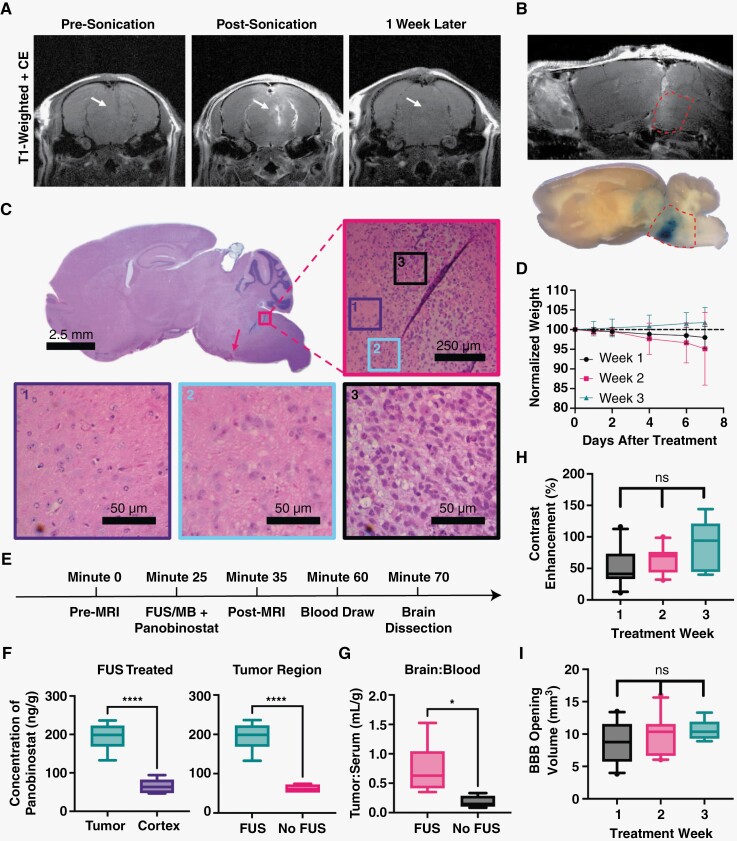
Figure 4.
Confirmation of BBB opening and increased delivery of panobinostat into DIPG tumors using MRI-guided FUS/MB at target region. (A) T1w CE MR images just before FUS/MB treatment (left), directly after treatment (center) showing BBB opening as bright spots owing to Gd extravasation and 1 week post-FUS treatment (right) showing closing (white arrows); all images are in the axial plane. (B) Confirmation of BBB opening in the sagittal plane by T1w MRI (top), and Evan’s blue dye (bottom). Pontine region outlined in red dotted line. (C) H&E staining of the whole brain, with a pink arrow illustrating the region of red blood cell extravasation. Figure is zoomed (50×) into the region on the border of tumor (pink) and healthy tissue. Also shown are zoomed-in regions of healthy tissue (purple border), tumor margin (blue border) and tumor (black border). (D) Plot showing the normalized body weight of each mouse after treatments. Data are split between weeks. There is no significant difference between each week. (E) Timeline of blood and brain sample collection. (F) LC-MS/MS results showing panobinostat concentration after MB+FUS treatment in the tumor region vs. cortex (left). Concentration difference between both tumor regions of FUS/MB-treated and untreated mice (right). (G) The tumor-to-serum ratio of panobinostat concentration for FUS/MB versus MBs alone (no FUS). (H) Contrast enhancement within the treated tumor region compared to the contralateral side. (I) Volume of BBB disruption determined by MRI T1w CE. Data represent mean ± standard deviation (n = 6 for A–C; n = 25 for D and E). Symbols *, **** represent P < .05 and P < .0001, respectively.

