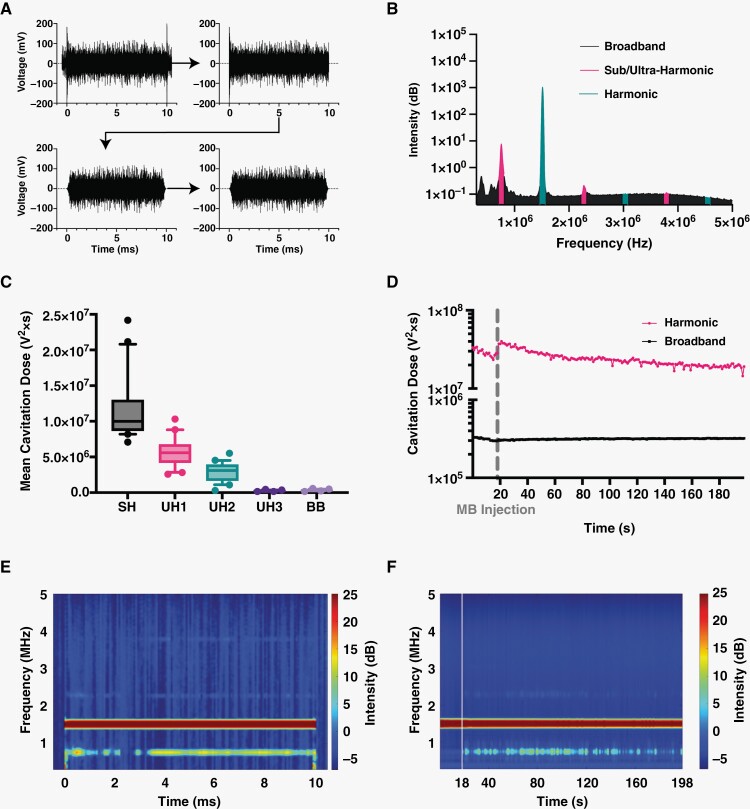
Figure 5.
Passive cavitation detection of microbubble activity. (A) Voltage data preprocessing including cropping, Tukey windowing, then low-pass filtering. (B) PCD voltage plot showing the area under the curve for sub/ultraharmonics, harmonics, and broadband peaks. (C) Normalized mean cavitation doses found at each area of interest including sub-harmonic, first, second, and third ultraharmonic, and broadband (SH, UH1, UH2, UH3, BB, respectively). Data represent mean ± standard deviation (n = 20). (D) Cavitation doses calculated at each FUS pulse and plotted over the entire FUS treatment. A break in the ordinate was made to better view both curves. Each point represents the mean (n = 20). (E) Representative spectrogram of single 10-ms pulse with 0.5 ms recording before and after. (F) Representative spectrogram of a whole treatment where each 10-ms pulse is shown for each second (1 Hz pulse repetition frequency). Time in between FUS pulses is not shown. Vertical line represents the time when microbubbles were injected.

