. 2023 Oct 3;12:RP88189. doi: 10.7554/eLife.88189

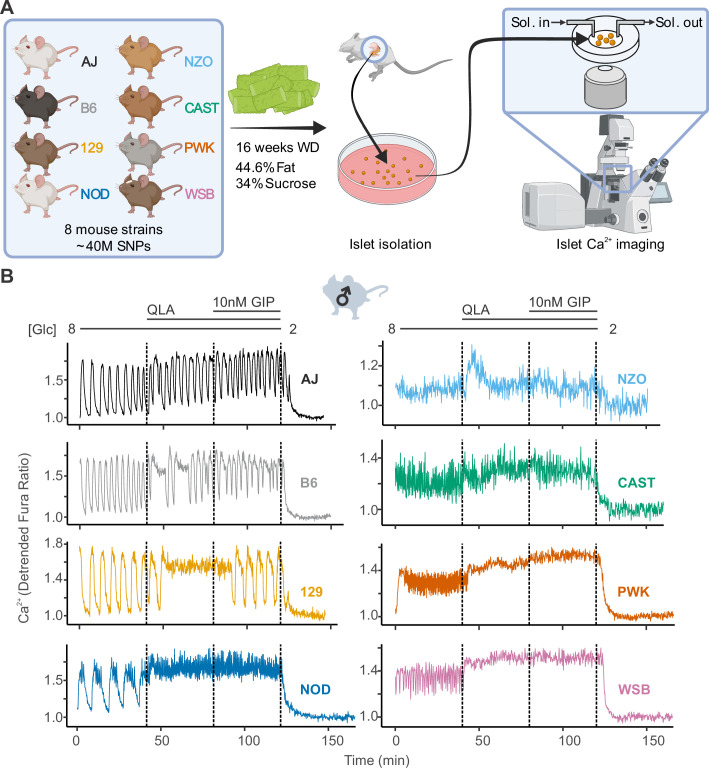
Figure 1. High diversity in Ca2+ oscillations across eight genetically distinct mouse strains.

(A) Male and female mice from eight strains (A/J; C57BL/6J (B6); 129S1/SvImJ (129); NOD/ShiLtJ (NOD); NZO/HILtJ (NZO); CAST/EiJ (CAST); PWK/PhJ (PWK); and WSB/EiJ (WSB)) were placed on a Western diet (WD) for 16 weeks before their islets were isolated. The islets were then imaged on a confocal microscope using Fura Red dye under conditions of 8 mM glucose (8G); 8G + 2 mM L-glutamine, 0.5 mM L-leucine, and 1.25 mM L-alanine (8G/QLA); 8G/QLA + 10 nM glucose-dependent insulinotropic polypeptide (8G/QLA/GIP); and 2 mM glucose. (B) Representative Ca2+ traces for male mice (n = 3–8 mice per strain, and 15–83 islets per mouse), with the transitions between solution conditions indicated by dashed lines. Abbreviations: ‘[Glc]’ = ‘concentration of glucose in mM’; ‘Sol.’ = ‘solution’; ‘SNPs’ = ‘single-nucleotide polymorphisms’.

Figure 1.

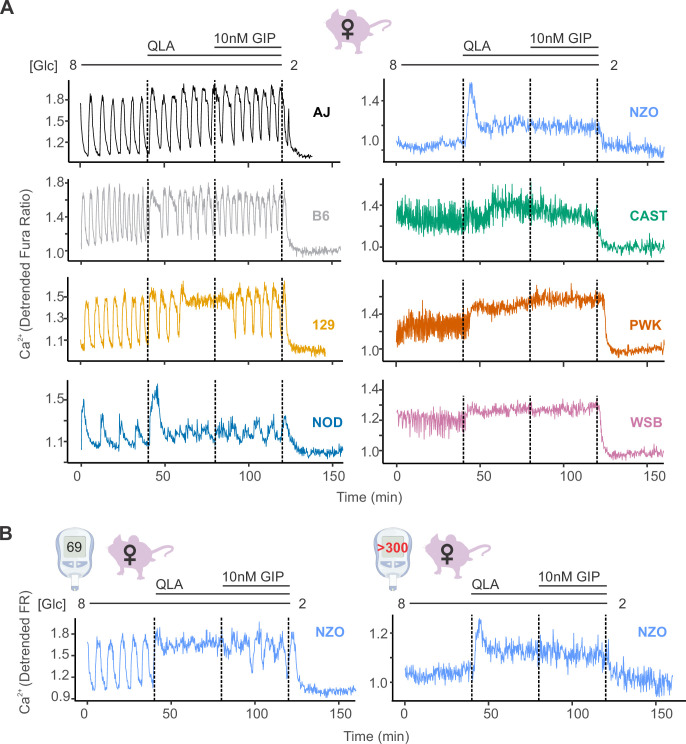
Figure 1—figure supplement 1. The high diversity in Ca2+ oscillation in males is also observed in female mice.

Figure 1—figure supplement 1.

(A) Representative Ca2+ traces for female mice (n = 3–7 mice per strain, and 11–94 islets per mouse) exhibit a high degree of variability across the eight strains. Abbreviations: ‘[Glc]’ = ‘concentration of glucose in mM’. (B) Representative Ca2+ trace for non-diabetic NZO female (left panel, fasting plasma glucose 69 mg/dl) and a diabetic NZO female (right trace, fasting plasma glucose >300 mg/dl). Related to Figure 1.
Figure 1—figure supplement 2. Diverse responses in non-diabetic NOD females’ islets.
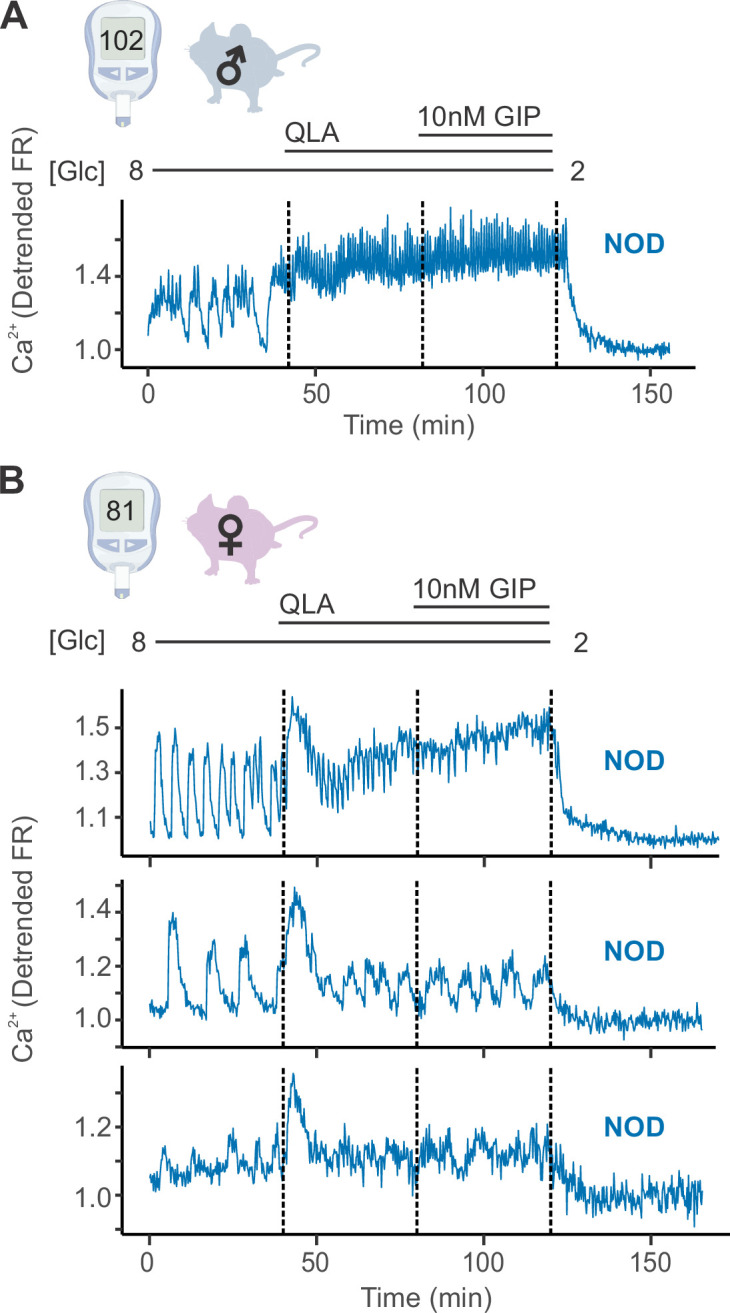
Figure 1—figure supplement 2.

(A) Representative Ca2+ traces for a male NOD mouse, for which islets closely resemble the trace pattern shown. (B) Example traces from islets of a single non-diabetic NOD female mouse. The pattern observed, where some of the mouse’s islets appeared similar to the NOD male islets (top panel), some appeared similar to the diabetic NZO islets (bottom panel), and some presented with an intermediate phenotype (oscillations present in all stimulatory conditions, but with a more pronounced 8/QLA initial peak and diminished amplitudes; middle panel), was consistently observed for all the NOD females. Abbreviations: ‘[Glc]’ = ‘concentration of glucose in mM’. Related to Figure 1.