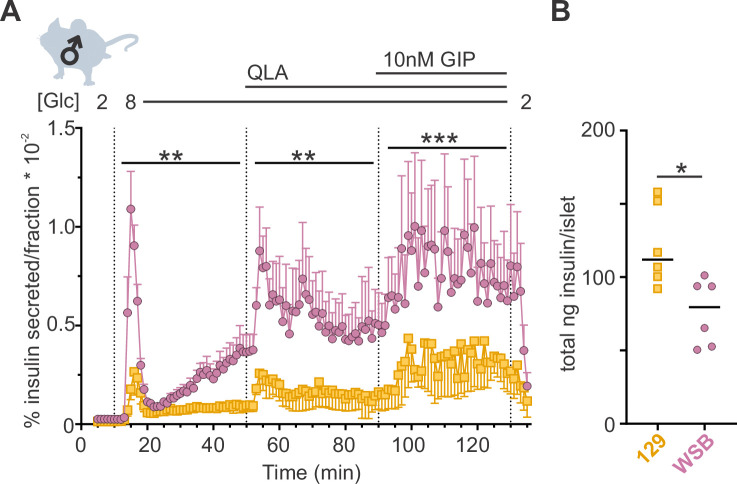
Figure 3. WSB mice secrete significantly more insulin than 129 mice.
(A) Insulin secretion was measured for perifused islets from WSB (n = 6, magenta circles) and 129 (n = 5, yellow squares) male mice in 2 mM glucose, 8G, 8G/QLA, and 8G/QLA/GIP. Transitions between solutions are indicated by dotted lines and the conditions for each are indicated above the graph. ‘[Glc]’ denotes the concentration of glucose in mM. Data are shown as a percentage of total islet insulin (mean ± standard error of the mean [SEM]). (B) Average total insulin per islet for the WSB and 129 males used in (A) with one exception: islets from one of the 129 mice were excluded from perifusion analysis due to technical issues with perifusion system on the day those animals’ islets were perifused. Dots represent individual values, and the mean is denoted by the black line. For (A), asterisks denote strain effect for the area-under-the-curve of the section determined by two-way analysis of variance (ANOVA), mixed effects model; **p < 0.01, ***p < 0.001. For (B), asterisk denotes p < 0.05 from Student’s t-test with Welch’s correction.


