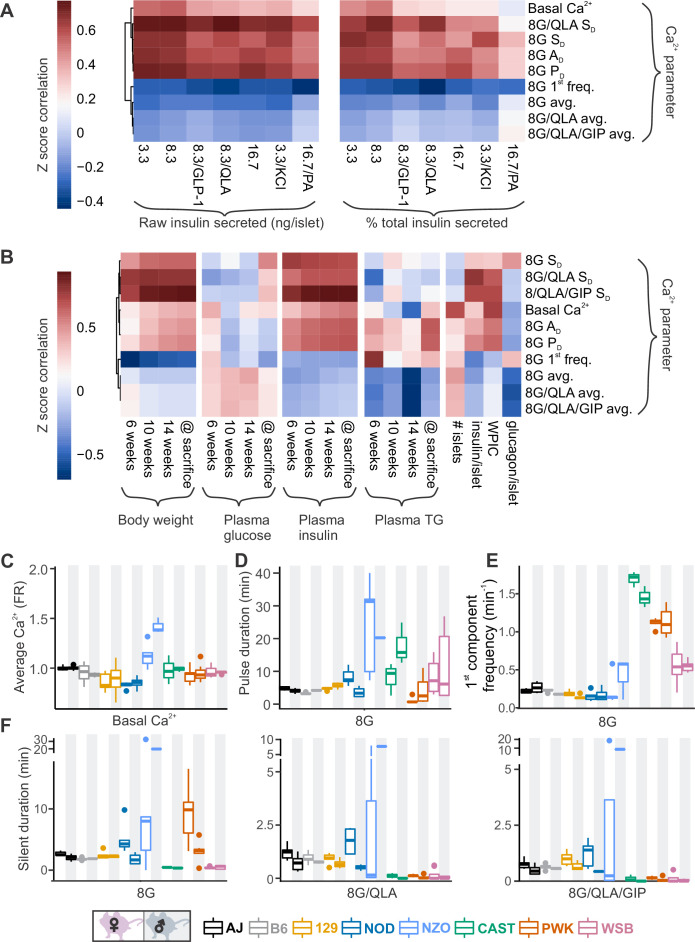
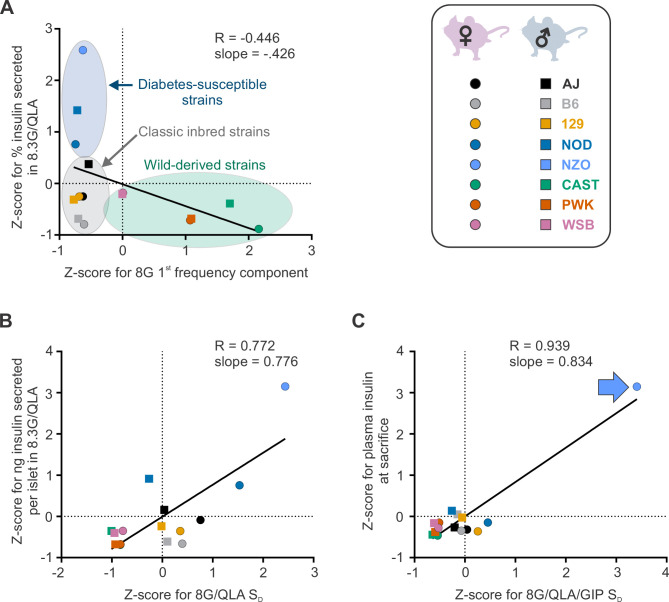
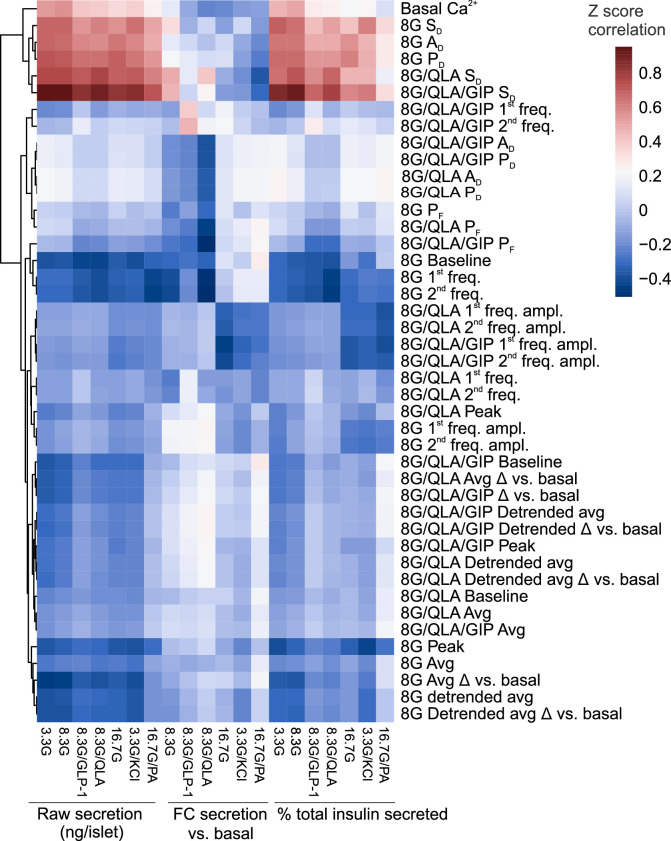
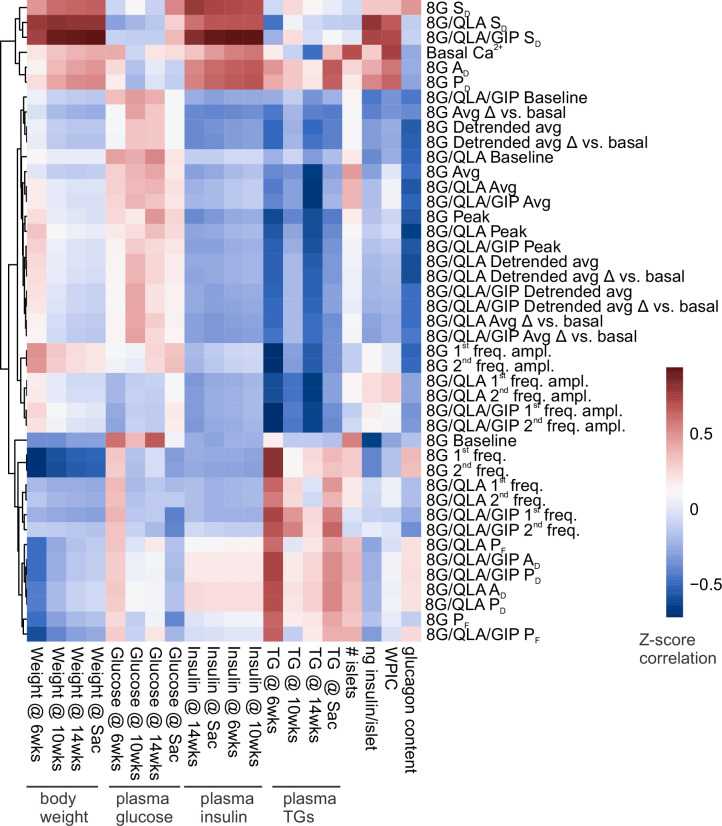
Figure 4. Comparing sex and strain patterns for Ca2+ metrics, insulin secretion, and clinical traits nominates Ca2+ metrics of interest.
(A) The Z-score correlation coefficient was calculated for Ca2+ parameters and raw insulin secreted and % total insulin secreted. Insulin measurements were previously collected for seven different secretagogues (16.7 mM glucose + 0.5 mM palmitic acid (16.7G/PA); 3.3 mM glucose + 50 mM KCl (3.3G/KCl); 16.7 mM glucose (16.7G); 8.3 mM glucose + 1.25 mM L-alanine, 2 mM L-glutamine, and 0.5 mM L-leucine (8.3G/QLA); 8.3 mM glucose + 100 nM GLP-1 (8.3G/GLP-1); 8.3 mM glucose (8.3G); and 3.3 mM glucose (3.3G)) (Mitok et al., 2018). (B) Correlation of the Ca2+ parameters to the clinical measurements in the founder mice which include (1) plasma insulin, triglycerides (TG), and glucose at 6, 10, and 14 weeks as well as at time of sacrifice; (2) number of islets; (3) whole-pancreas insulin content (WPIC); and (5) islet content for insulin and glucagon. For (A) and (B), the Ca2+ parameters shown here include average Ca2+ in 2 mM glucose (basal Ca2+); average Ca2+ in 8 mM glucose (8G avg.); average Ca2+ in 8 mM glucose + 1.25 mM L-alanine, 2 mM L-glutamine, and 0.5 mM L-leucine (8G/QLA avg); average Ca2+ in 8 mM glucose + QLA + 10 nM GIP (8G/QLA/GIP avg.); pulse duration in 8 mM glucose (8G PD); active duration in 8G (8G AD); silent duration in 8G (8G SD), 8G/QLA (8G/QLA/SD), and 8G/QLA/GIP (8G/QLA/GIP SD); and 1st component frequency in 8 mM glucose (8G 1st freq.). Other parameters analyzed are indicated in Figure 4—figure supplement 2 and Figure 4—figure supplement 3. (B–E) Sex and strain variability for (C) average Ca2+ determined by the Fura-ratio (FR) in 2 mM glucose, (D) pulse duration of oscillations in 8G, (E) 1st component frequency in 8G, and (F) silent duration of oscillations in 8G, 8G/QLA, and 8G/QLA/GIP.


