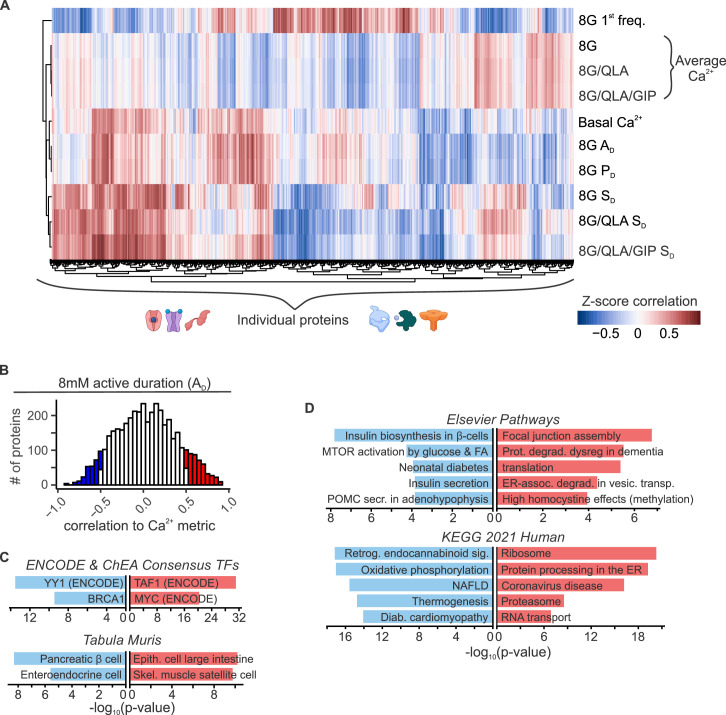
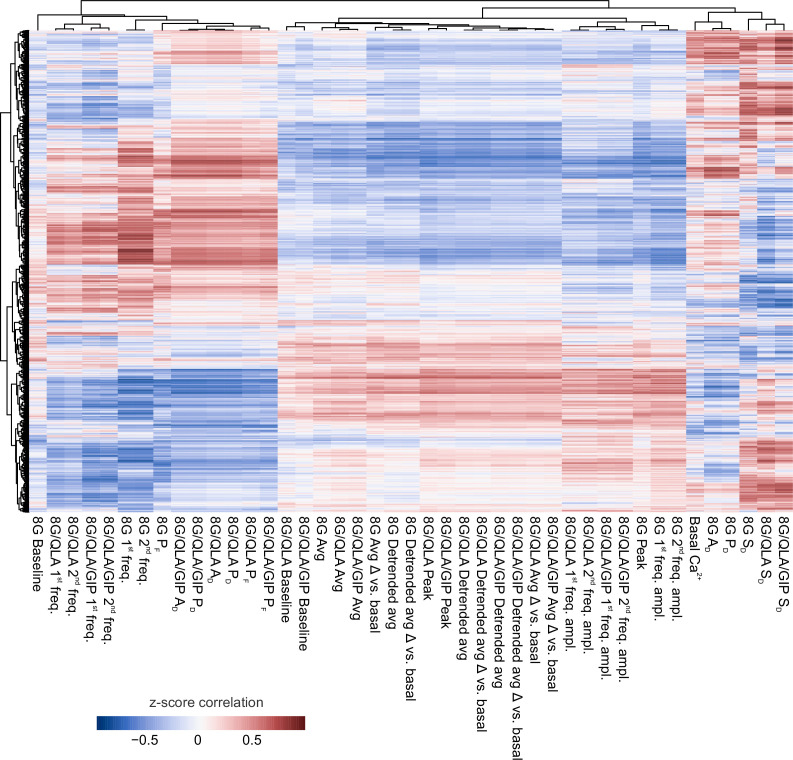
Heatmap displaying unsupervised clustering of the correlation coefficients between the
Z-scores for Ca
2+ wave metrics and the
Z-scores for normalized islet protein abundance. Islet proteins were quantified previously (
Mitok et al., 2018). Perifusion conditions included 8 mM glucose (8G); 8G mM glucose + 1.25 mM
L-alanine, 2 mM
L-glutamine, and 0.5 mM
L-leucine (8G/QLA); 8 mM glucose + QLA + 10 nM GIP (8G/QLA/GIP). Unsupervised clustering of the Ca
2+ wave parameters revealed several parameters highly correlated to multiple insulin secretion conditions. Parameters included: average Ca
2+ in 2 mM glucose (basal Ca
2+), in 8 mM glucose (8G avg.), in 8G/QLA (8G/QLA avg), and in 8G/QLA/GIP (8G/QLA/GIP avg.); average detrended Ca
2+ in 8 mM glucose (8G detr. avg.), in 8G/QLA (8G/QLA detr. avg), and in 8G/QLA/GIP (8G/QLA/GIP detr. avg.); average change in Ca
2+ vs. basal in 8 mM glucose (8G avg. Δ vs. 2G), in 8G/QLA (8G/QLA avg. Δ vs. 2G), and in 8G/QLA/GIP (8G/QLA/GIP avg. Δ vs. 2G); change in detrended average Ca
2+ vs. basal in 8 mM glucose (8G detr. Δ vs. 2G), in 8G/QLA (8G/QLA detr. Δ vs. 2G), and in 8G/QLA/GIP (8G/QLA/GIP detr. Δ vs. 2G); average oscillation peak Ca
2+ in 8G (8G peak), in 8G/QLA (8G/QLA peak), and in 8G/QLA/GIP (8G/QLA/GIP peak); average oscillation baseline Ca
2+ in 8G (8G baseline), in 8G/QLA (8G/QLA baseline), and in 8G/QLA/GIP (8G/QLA/GIP baseline); pulse duration in 8G (8G
PD), in 8G/QLA (8G/QLA
PD), and in 8G/QLA/GIP (8G/QLA/GIP
PD); active duration in 8G (8G
AD), in 8G/QLA (8G/QLA
AD), and in 8G/QLA/GIP (8G/QLA/GIP
AD); silent duration in 8 mM glucose (8G
SD), in 8G/QLA (8G/QLA
SD), and in 8G/QLA/GIP (8G/QLA/GIP
SD); plateau fraction in 8 mM glucose (8G
PF), in 8G/QLA (8G/QLA
PF), and in 8G/QLA/GIP (8G/QLA/GIP
PF); spectral density 1st component frequency in 8 mM glucose (8G 1st freq.), in 8G/QLA (8G/QLA 1st freq.), and in 8G/QLA/GIP (8G/QLA/GIP 1st freq.); spectral density 2nd component frequency in 8 mM glucose (8G 2nd freq.), in 8G/QLA (8G/QLA 2nd freq.), and in 8G/QLA/GIP (8G/QLA/GIP 2nd freq.); contribution of the 1st component to the Ca
2+ waveform for 8 mM glucose (8G 1st freq. amp.), for 8G/QLA (8G/QLA 1st freq. amp.), and for 8G/QLA/GIP (8G/QLA/GIP 1st freq. amp.); and contribution of the 2nd component to the Ca
2+ waveform for 8 mM glucose (8G 2nd freq. amp.), for 8G/QLA (8G/QLA 2nd freq. amp.), and for 8G/QLA/GIP (8G/QLA/GIP 2nd freq. amp.). Related to
Figure 5.


