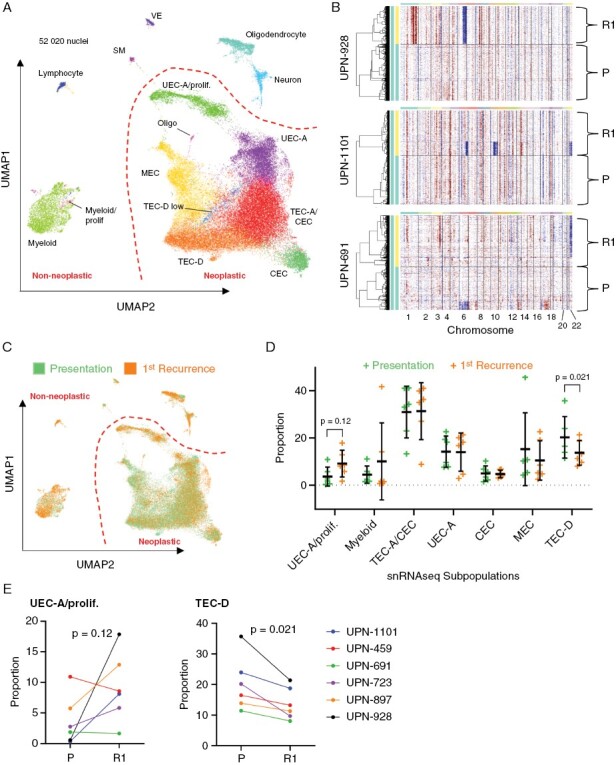
Figure 3.

Single-nuclei RNAseq analysis of subclone and neoplastic subpopulation trajectories from presentation to recurrence in PFA. (A) Aligned UMAP projection of single-nuclei expression data of 7 PFA patient samples pairs from presentation and 1st recurrence reveals neoplastic and non-neoplastic cell type clusters (Abbreviations: CEC, ciliated EPN cell; MEC, mesenchymal EPN cell; SM; smooth muscle; TEC, transportive EPN cell; UEC, undifferentiated EPN cell; VE, vascular endothelium). (B) Inference of CNVs (inferCNV) in neoplastic single nuclei in three representative PFA presentation (P)/1st recurrence (R1) pairs, exemplifying gain of 1q and loss of 6q at recurrence (top panel), subclonal loss of 6q, 10q, and 22 at recurrence (middle panel), and loss of 22 at recurrence (bottom panel). (C) tumor stage overlaid on to aligned UMAP projection of PFA single nuclei. (D) Major neoplastic and non-neoplastic subpopulation proportions presentation and 1st recurrence samples. (E) ladder plot depicting individual sample changes in the UEC-A/proliferative (left panel) and TEC-D ependymally differentiated (right panel) neoplastic cluster proportion between presentation and 1st recurrence.
