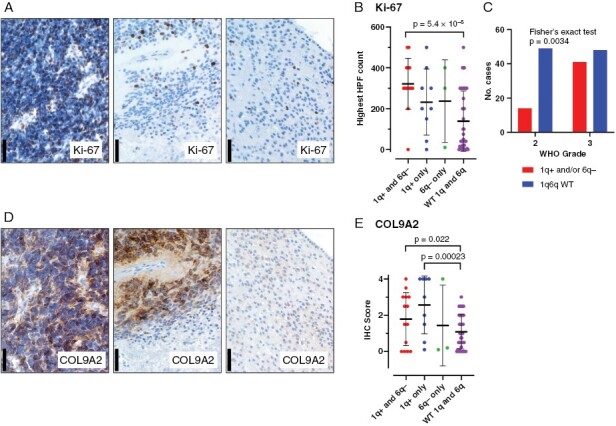
Figure 5.

Histological characteristics of 1q+ and/or 6q− samples with respect to proliferative marker Ki-67 and UEC-A progenitor subpopulation marker COL9A2. (A) Representative IHC staining of proliferative marker Ki-67 in 1q+/6q− co-occurrence (left panel), 1q+ only (middle panel) and 1q/6q wildtype PFA (scale bars = 50 µm). (B) Ki-67 positive cell count per highest high power field (HPF) in individual patient samples grouped according to (i) 1q+ and 6q− co-occurrence (1q+ and 6q−; n = 14), (ii) 1q+ with wildtype 6q (1q+ only; n = 9), (iii) 6q− with wildtype 1q (6q− only; n = 3), and (iv) wildtype 1q and 6q (WT 1q and 6q; n = 27). (C) Contingency analysis of CNVs status versus WHO grade (n = 152) (Fisher’s exact test). (D) Representative IHC staining of proliferative neuroepithelial UEC-A subpopulation marker COL9A2 in 1q+/6q− co-occurrence (left panel), 1q+ only (middle panel) and 1q/6q wildtype PFA. (E) COL9A2 IHC scores in individual patient samples grouped according to CNV status as in panel B.
