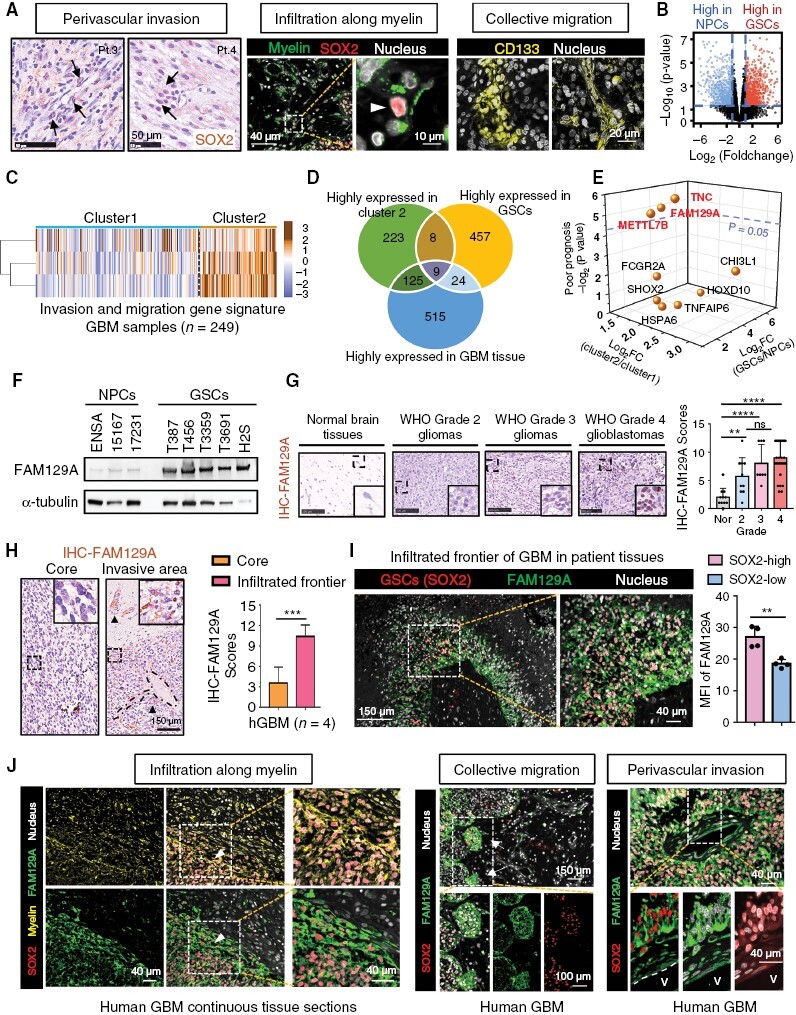
Figure 1.

Identification of essential molecules in invasive GSCs. (A) Three manifestations of GSCs invasion. Left: immunohistochemical staining of SOX2 (marker of GSC) in perivascular areas of GBM, scale bars: 50 μm; Middle and right: Immunofluorescence staining in human GBM, MBP (marker of myelin sheath) is shown in green, SOX2 in red, CD133 (marker of GSC) in yellow and DAPI in gray. Scale bars: middle, 10 μm; right, 20 μm. (B) Volcano plot showing the distribution of differential genes in 44 GSCs and 10 NPCs (GSE119834). High-expressed genes in GSCs is shown in red, and that in NPCs is blue. (Cutoff: fold change >2, adjusted P value < .01). (C) Heatmap reflecting cluster grouping according to the ssGSEA scores of invasive and migrative gene signatures. Dataset for running ssGSEA: CGGA-GBM cohort (n = 249; cluster 1: low invasion and migration scores, n = 171; cluster 2: high invasion and migration scores, n = 78). (D) Venn diagram showing genes that were highly expressed in cluster 2 GBM patients (compared to cluster 1), GSC (compared to NPC) and GBM tissues (compared to normal brain tissues). (E) Scatter plot showing the distribution of priority of candidate genes. (F) Western blotting of FAM129A protein in GSCs and NPCs. (G) Immunohistochemical staining of FAM129A in normal brain tissues and gliomas. Scale bars: 100 μm. And the right histogram describing the distribution of FAM129A IHC-scores (ns, no significance; **P < .01; ****P < .0001, one-way ANOVA followed by Tukey’s test). (H) Immunohistochemical staining of FAM129A in core and invasive region. Dotted line: blood vessels; Arrows: perivascular FAM129A positive cells. Scale bars: 100 μm. And right histogram depicting the IHC quantification of FAM129A in center and invasive frontier (n = 4). See the detailed pictures in Supplementary Figure S3. (I) Immunofluorescence staining of FAM129A (green) and SOX2 (red) in human GBM tissues. DAPI is shown in gray. Also shown is quantification of the mean fluorescence intensity (MFI) of FAM129A (right, n = 4). Scale bars: 150 μm; enlarged image: 40 μm. (J) Immunofluorescence staining in human GBM, MBP is shown in yellow, SOX2 in red, FAM129A in green and DAPI in gray. Scale bars: 40 μm; middle, 100 μm; right: 40 μm.
