Figure 2.

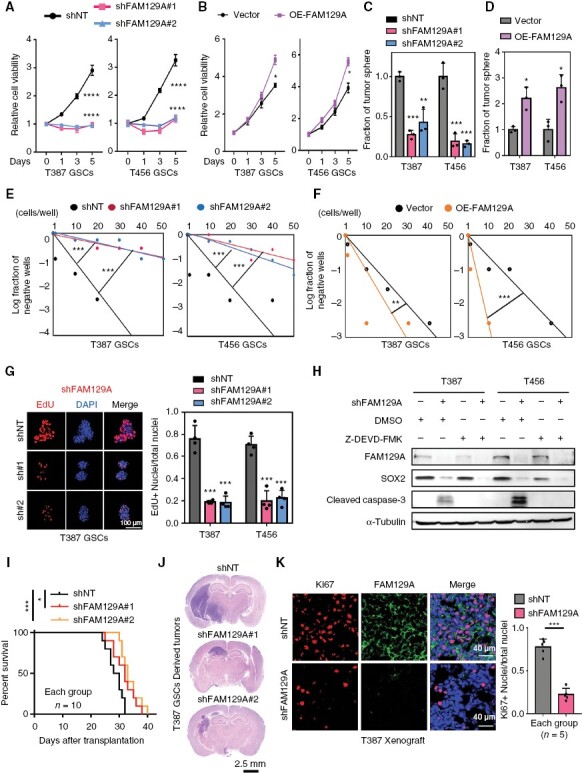
FAM129A maintains the self-renewal and tumorigenic potential of GSCs. (A, B) CellTiter-Glo assays displaying the measurement of GSC proliferation (n = 6). (C, D) Histogram showing the quantification of tumor-spheres formation (n = 3). (E, F) Limiting dilution assays showing the spheroidization efficiency in the indicated cells. (G) Confocal imaging (left) of EdU incorporation in GSC tumor-spheres (n = 4). And EDU is shown in red, DAPI in blue. Also shown is quantification of the fraction of EdU+ cells (right). Scale bars: 100 μm. (H) Western blot analysis of cleaved caspase-3 and SOX2 proteins in the indicated cells. Z-DEVD-FMK (20 μM), a caspase-3 inhibitor. (I) Kaplan–Meier survival curve of immunocompromised mice bearing T387 GSCs expressing shNT or shFAM129A (n = 10 for each group). (J) H&E staining of brain sections from immunocompromised mice 24 days after transplantation. Scale bars: 2.5 mm. (K) IF image (left) in xenografts. Ki67 is in red, FAM129A in green and DAPI in blue. Scale bars: 40 μm. Also shown is the quantification of the Ki67+ cell in GBM xenografts (n=5 for each group). Data are presented as the mean ± SD. *P < .05; **P < .01; ***P < .001.
