Figure 3.

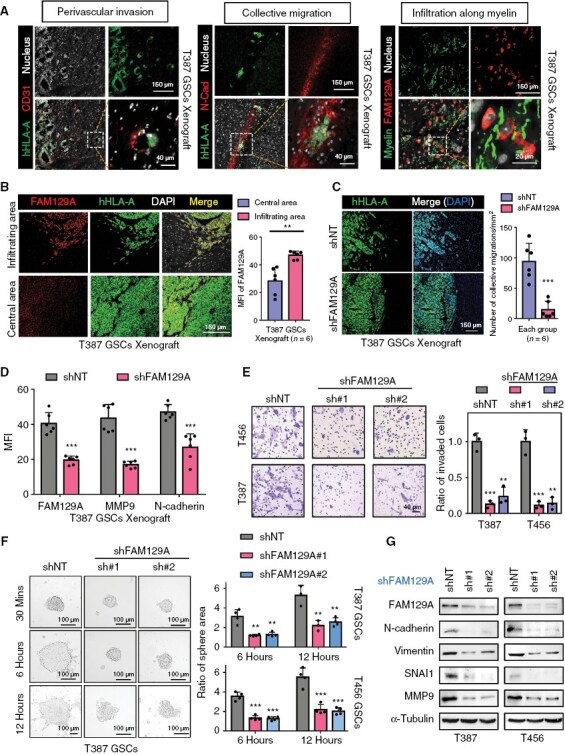
FAM129A is essential for invasion of GSCs. (A) Three manifestations of GSCs invasion in xenograft. hHLA-A: specific labeling of human-derived tumor cells; CD31: marker of vessels; N-cad: N-cadherin, a cell adhesion molecule; MBP: marker of myelin; Scale bars: 150 μm; enlarged image: 20 μm. (B) IF staining of FAM129A and hHLA-A in tumor periphery or center of xenograft. Also shown is quantification of the mean fluorescence intensity (MFI) of FAM129A (right, n = 6). Scale bars: 150 μm. (C) IF staining of hHLA-A in xenograft. Also shown is quantification of number of collective migrations in tumor periphery (right, n = 6). Scale bars: 150 μm. (D) MFI quantification of FAM129A, MMP9 and N-cadherin in T387 GSCs xenograft transduced with shNT or shFAM129A (n = 6). See the detailed pictures in Supplementary Figure S6B. (E) Transwell assay showing the effect of FAM129A on GSCs invasion. Also shown is quantification of number of invading cells (right, n = 3). Scale bars: 40 μm. (F) Bright-field microscopy (left) showing the tumor-sphere extension of T387 GSCs transduced with shNT or shFAM129A. And the quantification of relative extension is shown (right, n = 4). Scale bars: 100 μm. (G) Western blot analysis of FAM129A and EMT-related proteins in the indicated cells. Data are presented as the mean ± SD. *P < .05; **P < .01; ***P < .001.
