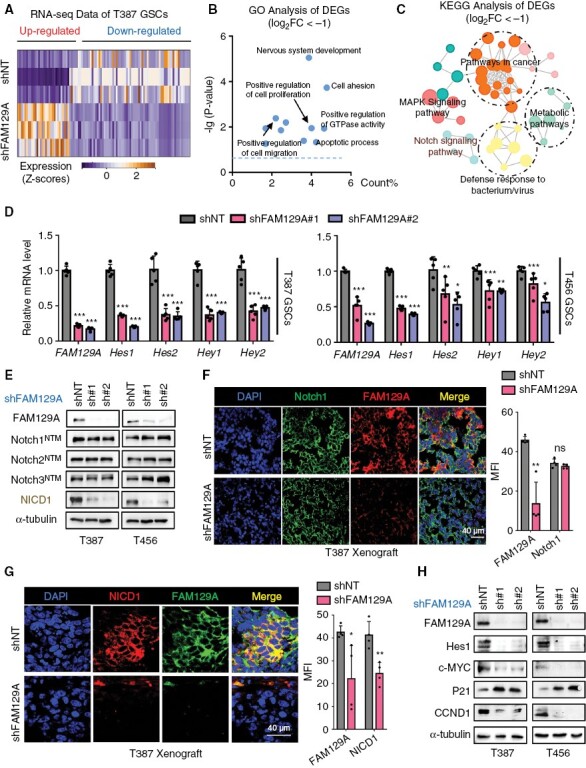
Figure 4.

FAM129A knockdown inhibits Notch signaling in GSCs. (A) Heatmap reflecting the results of RNA-seq upon FAM129A knockdown. (B, C) Scatter plot reflecting the results of GO (B) and KEGG analysis (C) using RNA-seq data. (D) qRT-PCR analysis of mRNA expression of FAM129A, Hes1, Hes2, Hey1 and Hey2 in T387 and T456 GSCs transduced with shNT or shFAM129A (n = 5; one-way ANOVA with Tukey’s multiple comparisons). (E) Western blotting of FAM129A, Notch1NTM, Notch2NTM, Notch3NTM and NICD1 protein expression in the indicated cells. (F) IF co-staining of FAM129A and Notch1 in xenografts. And the quantification of MFI is shown (right, n = 4). Scale bars: 40 μm. (G) IF co-staining of FAM129A and NICD1 in xenografts. And the quantification of MFI is shown (right, n = 4). Scale bars: 40 μm. (H) Western blotting of FAM129A and NICD1 targets (CCND1, Hes1, c-MYC, P21 and MMP9) in indicated cells. Data are presented as the mean ± SD. ns, no statistical difference; *P < .05; **P < .01; ***P < .001.
