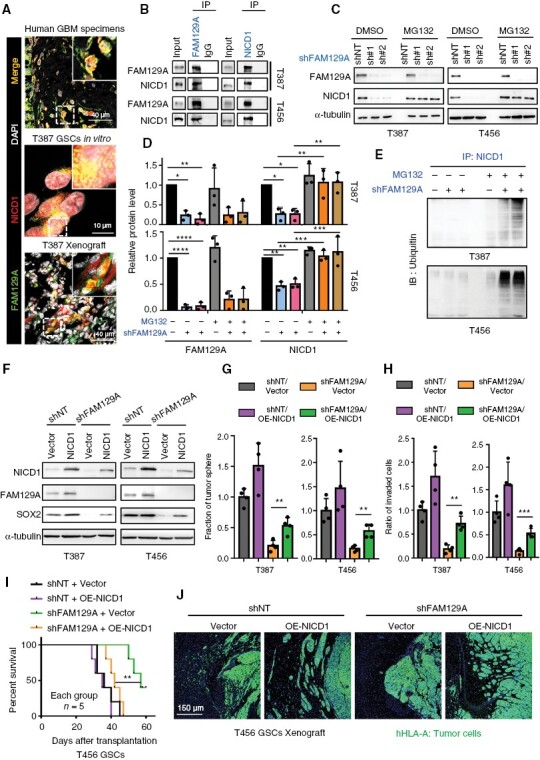
Figure 5.

Depletion of FAM129A caused proteasome-mediated degradation of NICD1. (A) IF co-staining of FAM129A and NICD1 in human GBM (scale bars, 40 μm), GSC (scale bars, 10 μm) and xenograft (scale bars, 40 μm). The thickness of tumor sections was 10 μm. (B) Co-immunoprecipitation of FAM129A (left) or NICD1 (right) in T456 and T387 GSC lines (IgG as a control antibody). (C, D) Western blotting of FAM129A and NICD1 in indicated cells. GSC was treated with MG132 6 h for harvest. And the quantification of protein is shown in (D). (E) Co-IP of NICD1 and then western blotted with anti-ubiquitin in T387 and T456 GSCs. Input is shown in Supplementary Figure S9F. (F) Western blotting of FAM129A, NICD1 and SOX2 in indicated cells. (G, H) Histogram showing the quantification of tumor-spheres formation (G) and number of invading cells (H). See the detailed pictures in Supplementary Figure S10B, C. (I) Kaplan–Meier survival curve of immunocompromised mice bearing T456 GSCs in indicated groups (n = 5 for each group). (J) IF staining of hHLA-A in xenograft. Scale bars: 150 μm. Data are presented as the mean ± SD. ns, no statistical difference; *P < .05; **P < .01; ***P < .001.
