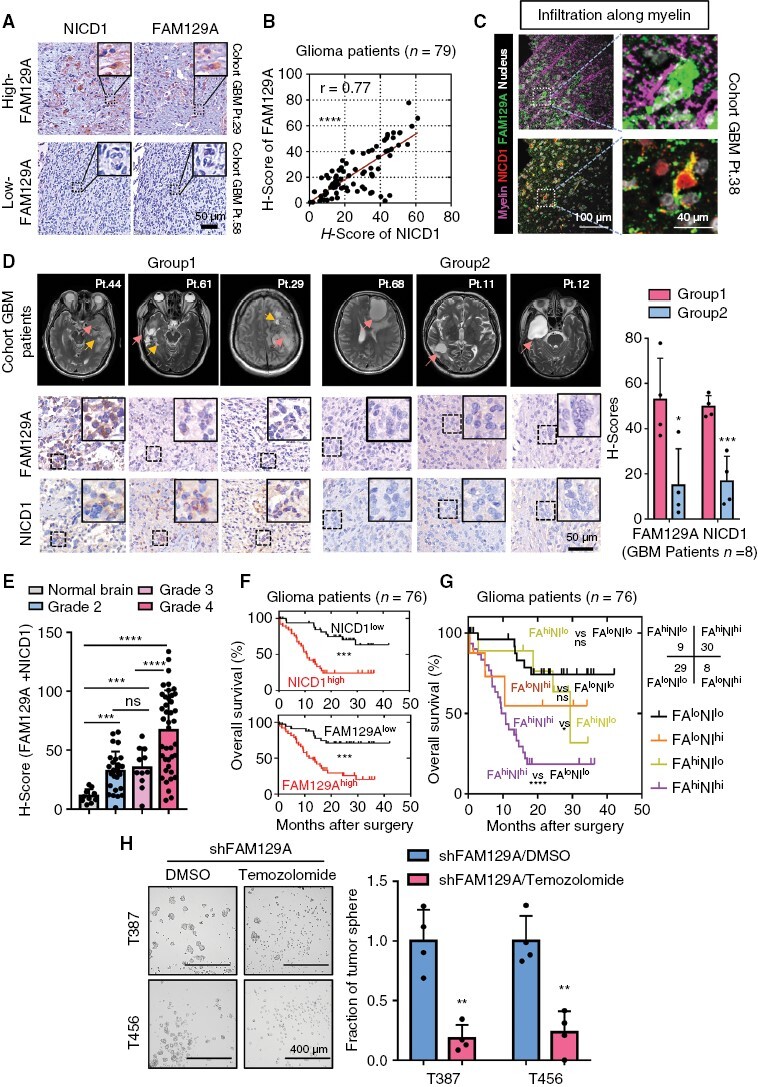
Figure 6.

The clinicopathological features and diagnostic value for prognosis of NICD1 and FAM129A complex in glioma cohort. (A) Immunohistochemical staining of FAM129A and NICD1 in same human GBM tissues. Scale bars: 50 μm. (B) Scatter plot indicating the correlation between FAM129A and NICD1 in 79 gliomas tissues. The clinical information and H-scores of 79 patients with glioma were detailed in Supplementary Table 2, which also corresponding to (B, D–G). (C) IF staining of FAM129A and NICD1 in infiltrated area along the myelin sheath. Scale bars: 100 μm; enlarged image: 40 μm. The thickness of tumor sections was 10 μm. (D) MRI T2 images of GBM patients and the corresponding histochemical staining of FAM129A and NICD1. All MRI images were obtained from the patients’ preoperative examination, at which time they did not receive any treatment. Pink arrows: main tumor body; Yellow arrows: the infiltrating front. Scale bars of IHC image: 50 μm. (E) Histogram describing the distribution of H-scores (FAM129A + NICD1) in different histopathological subgroups. Normal brain, n = 10; Grade 2, n = 26; Grade 3, n = 11; Grade 4, n = 41. (F) Overall survival curves of 76 glioma subjects based on immunohistochemical staining data of NICD1 (above) and FAM129A (bottom). (G) Kaplan–Meier survival curves of 76 glioma subjects based on the combination of FAM129A and NICD1 immunohistochemical staining data. (H) Bright-field microscopy indicating the representative images of tumor-sphere formation (scale bars: 400 μm). And histogram showing the quantification of tumor-spheres formation (n = 4). Data are presented as the mean ± SD. ns, no significance; *P < .05; **P < .01; ***P < .001; ****P < .0001.
