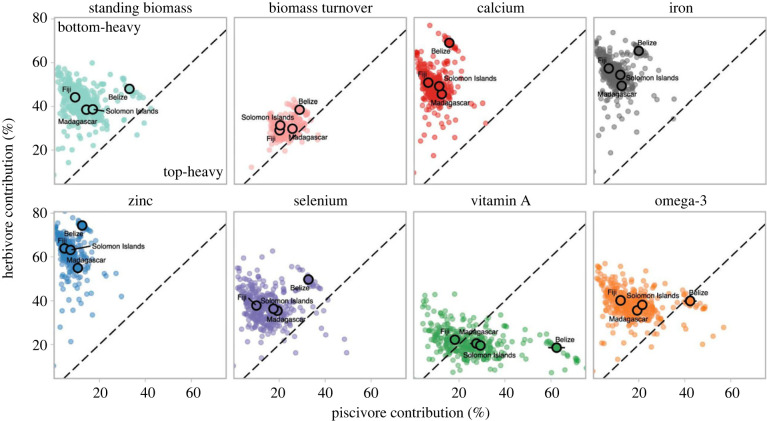
Figure 3.
Contribution of herbivores and piscivores to fishery services. Points show the posterior median predicted herbivore and piscivore contribution (%) to each fishery service, for all 333 reef surveys. Bolded points represent the mean values in each country (± 2 s.e.m.). Points in the upper-left have bottom-heavy pyramids (greater contributions from herbivores than piscivores) and points in the bottom-right have top-heavy pyramids (greater contributions from piscivores than herbivores). S.e.m. is provided in electronic supplementary material, table S1.

