
Figure 5.
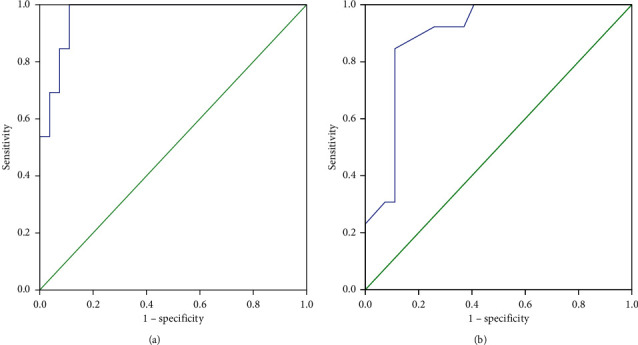
Receiver-operating characteristic curve comparing the predictive thresholds in the parenchymal disease group: (a) RSBI 5-120 (AUC = 0.966) and (b) RSBI 120 (AUC = 0.893).
Official websites use .gov
A
.gov website belongs to an official
government organization in the United States.
Secure .gov websites use HTTPS
A lock (
) or https:// means you've safely
connected to the .gov website. Share sensitive
information only on official, secure websites.
Receiver-operating characteristic curve comparing the predictive thresholds in the parenchymal disease group: (a) RSBI 5-120 (AUC = 0.966) and (b) RSBI 120 (AUC = 0.893).