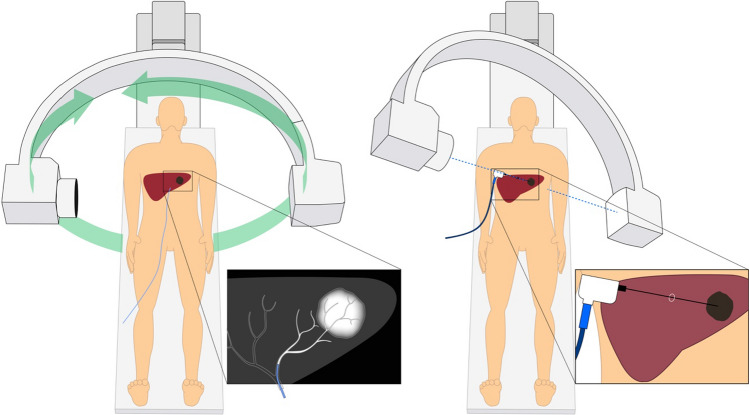
Fig. 2.
Schematic of the HepACAGA technique. Left panel: C-arm CT is obtained during contrast injection through a catheter placed in the hepatic artery. Left insert: tumor enhancement due to selective contrast injection. Right panel: the C-arm is automatically positioned in a way that the entry point and target are aligned (entry point view). The entry point and target are projected on the live fluoroscopy images. Right insert: positioning of the microwave antenna through the projected entry point into the target

